PT Sarana Menara Nusantara Tbk.'s management explains the business in its own materials. The slides below do the most of that work, pulled from the documents preserved in Sources. Each source link opens the complete presentation at that slide in a new tab.
The company's fullest self-explanation in English — from business model and tower unit economics through segments, financials and debt. · Open the full document →
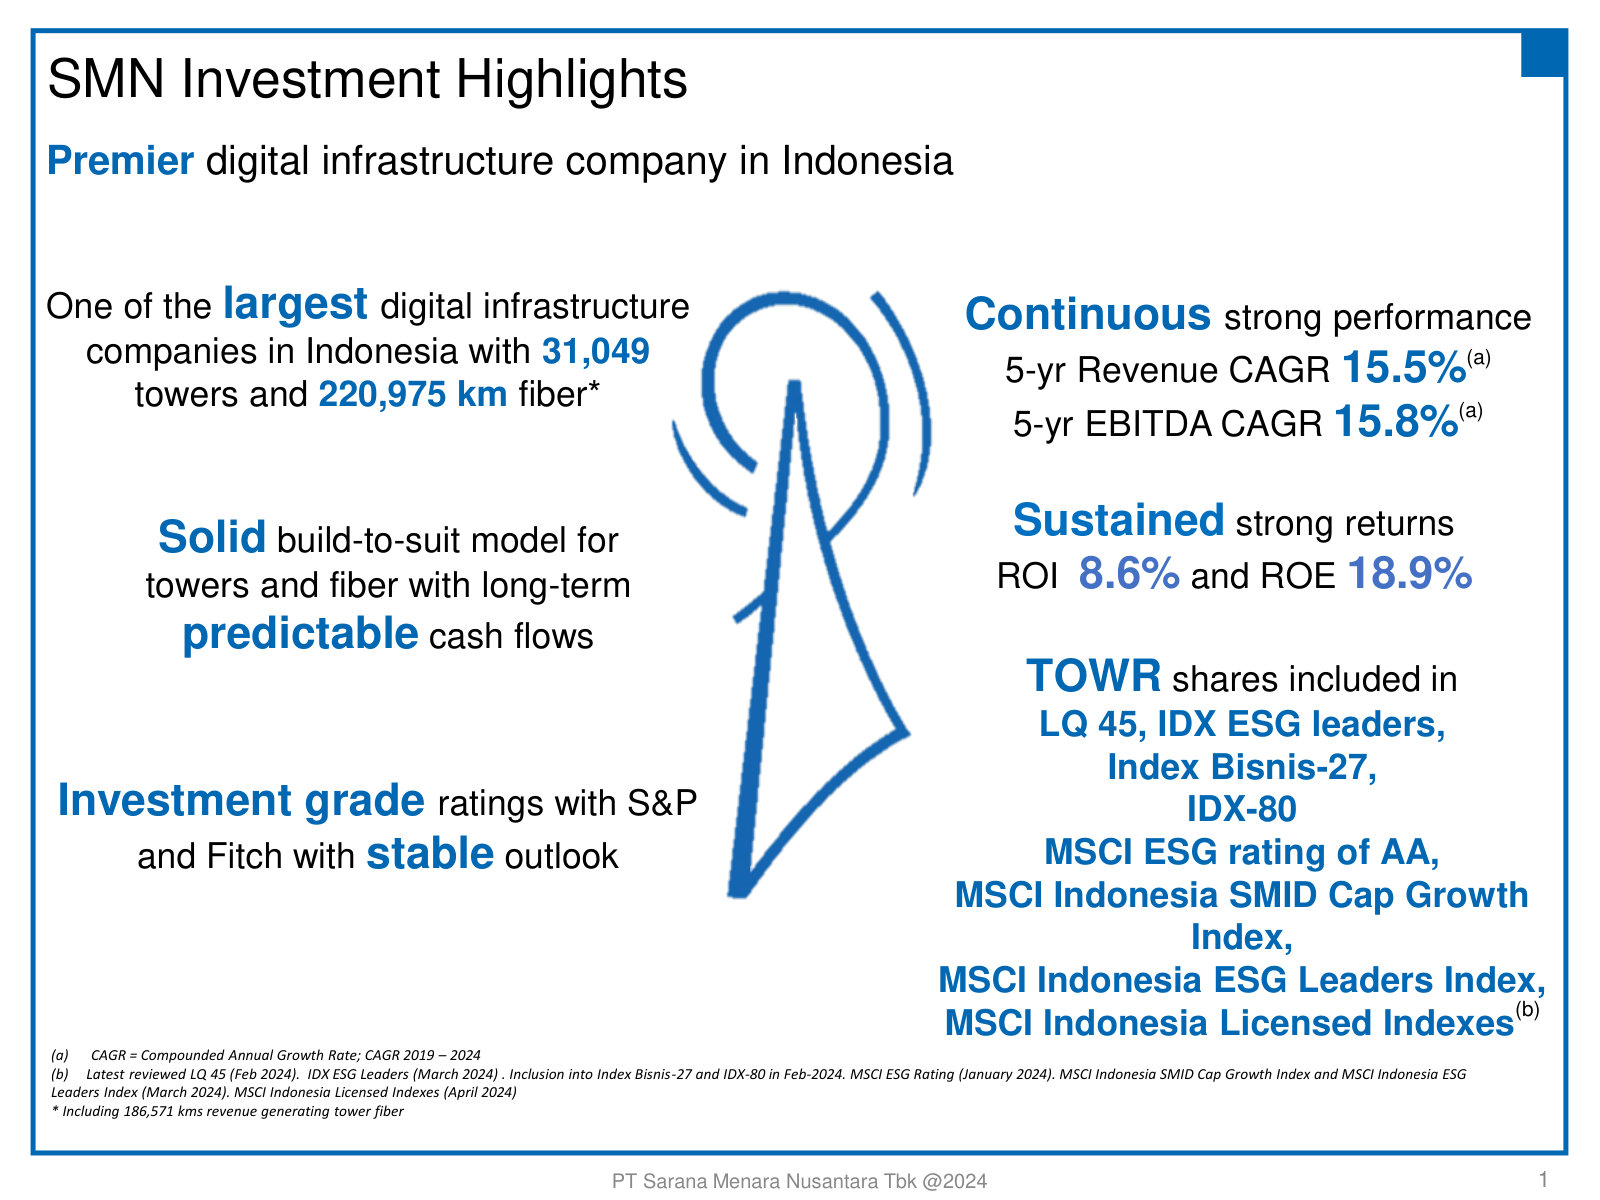
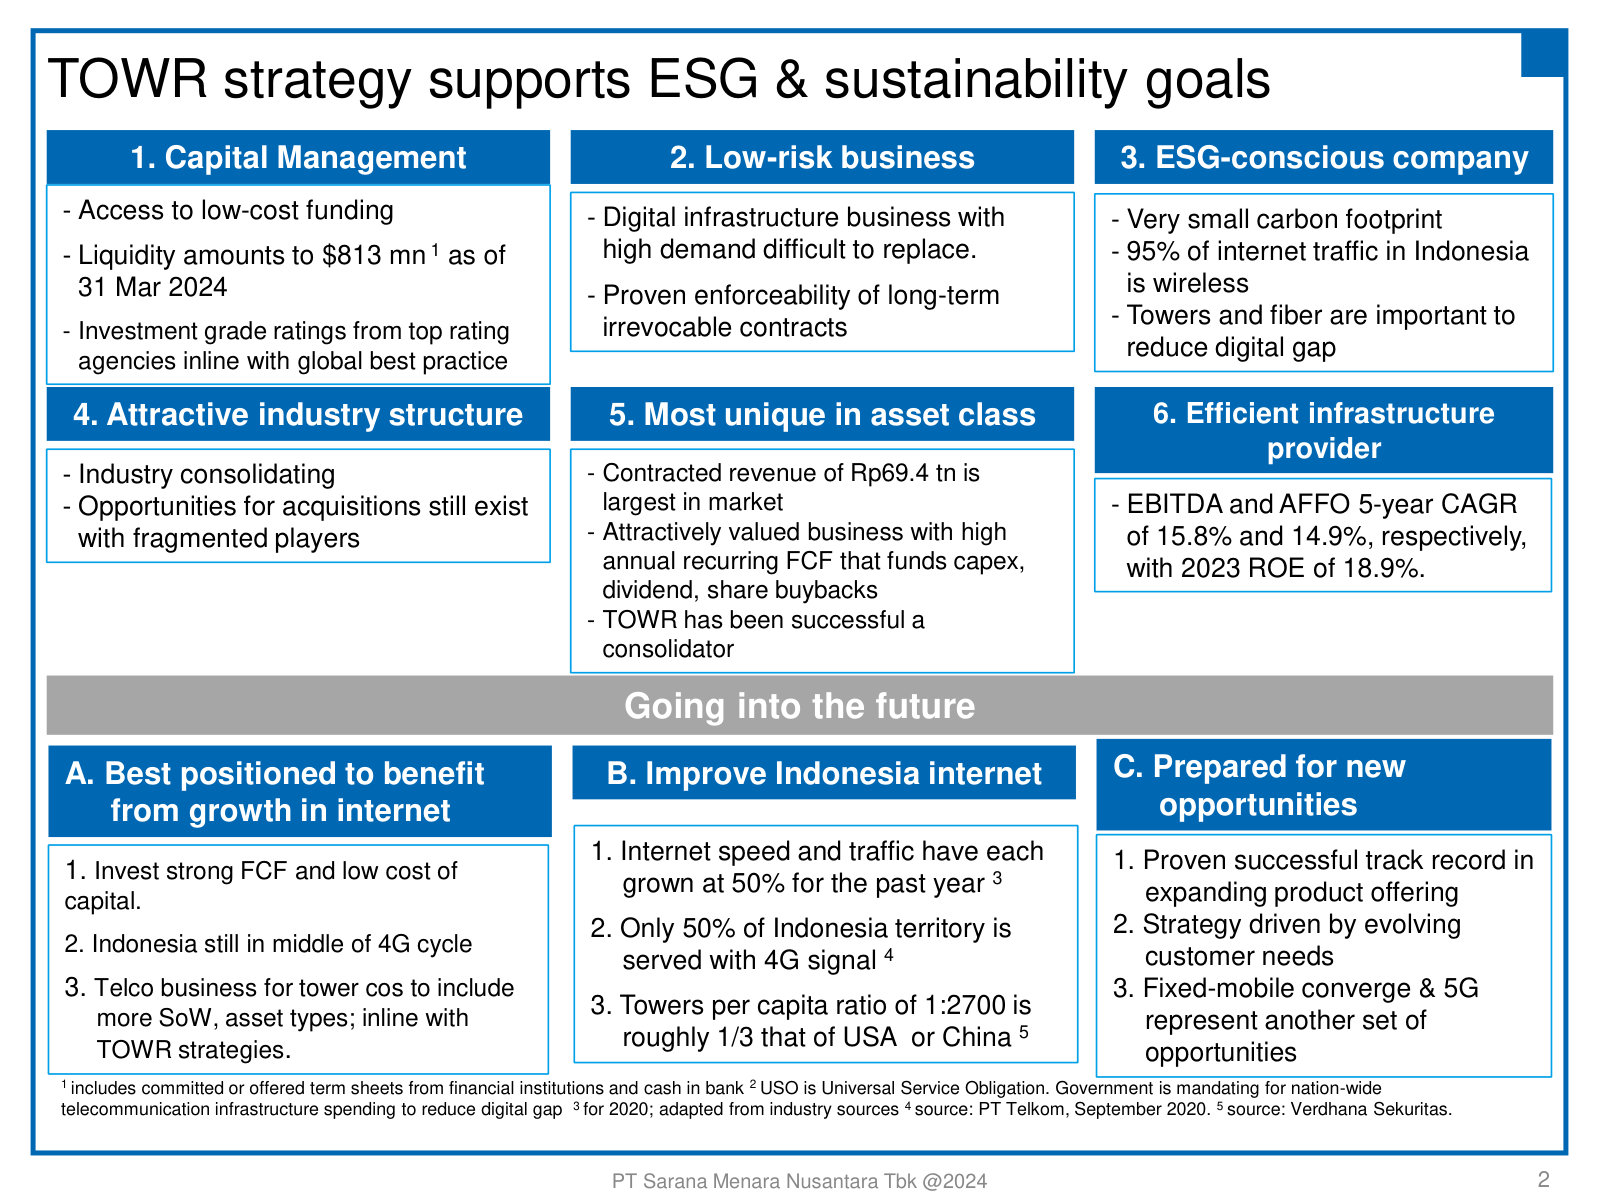
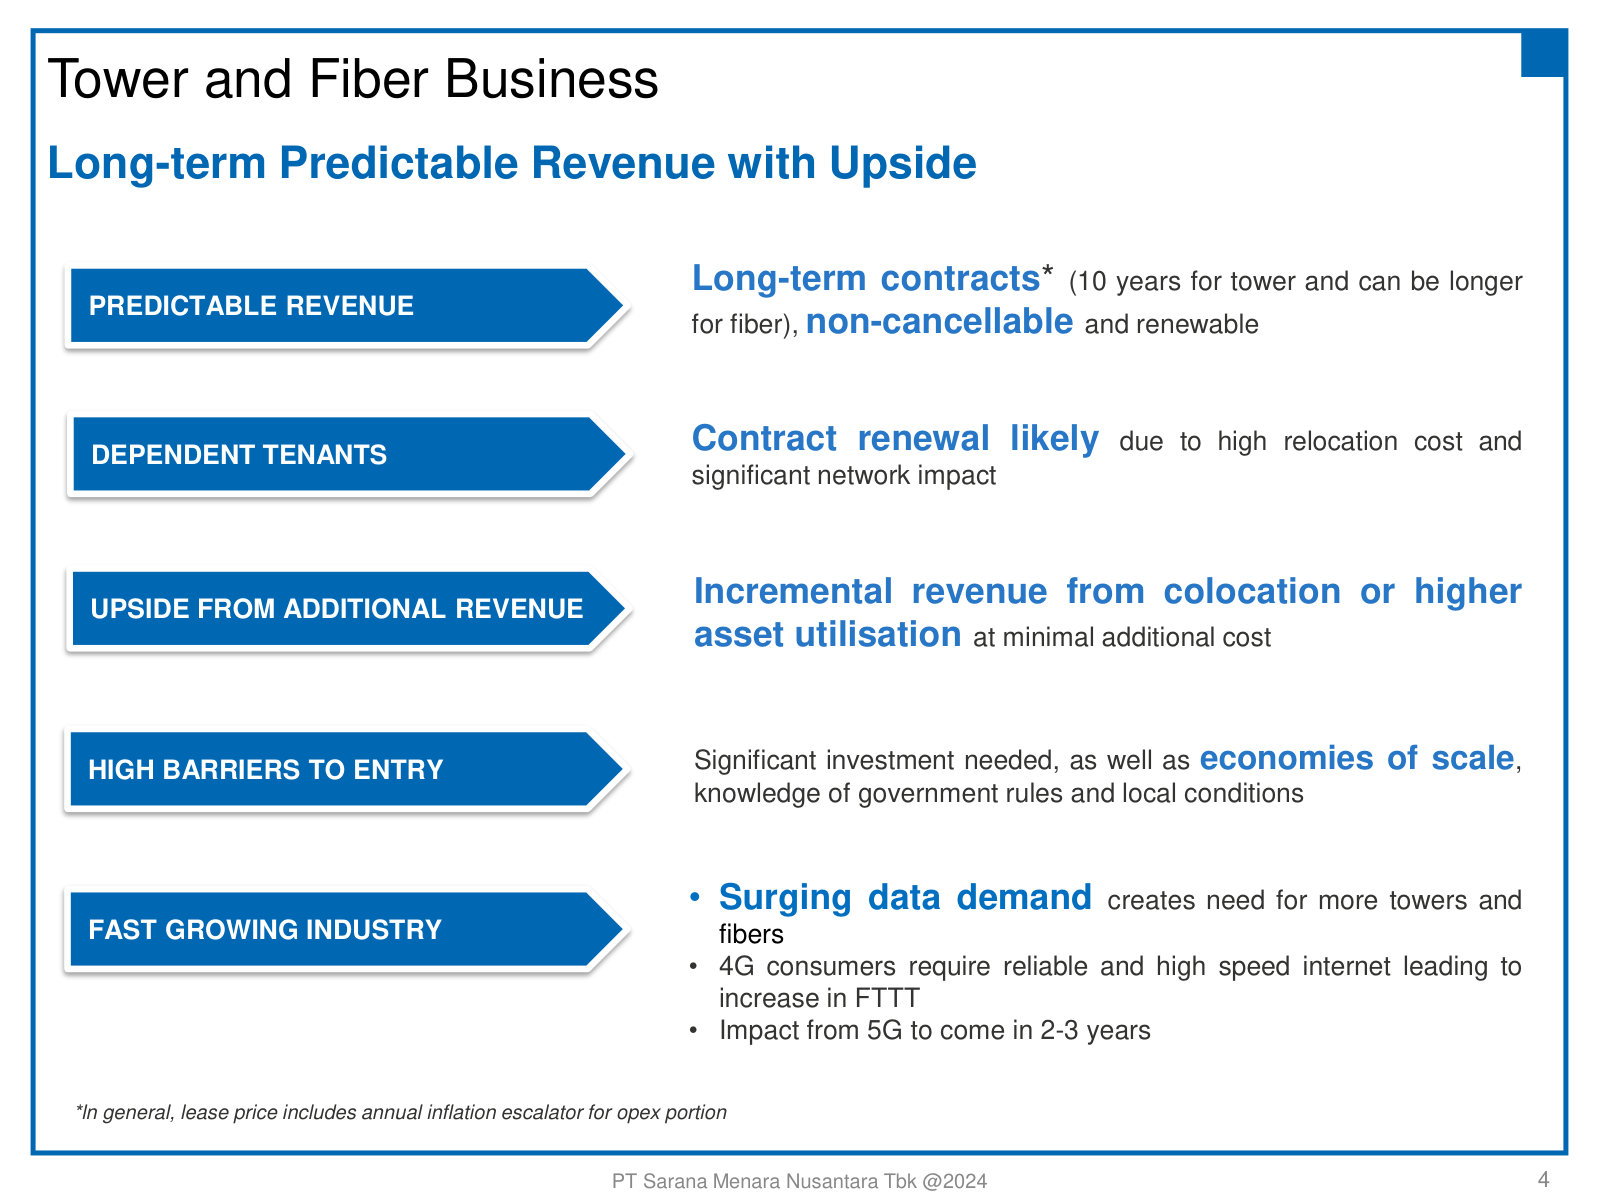
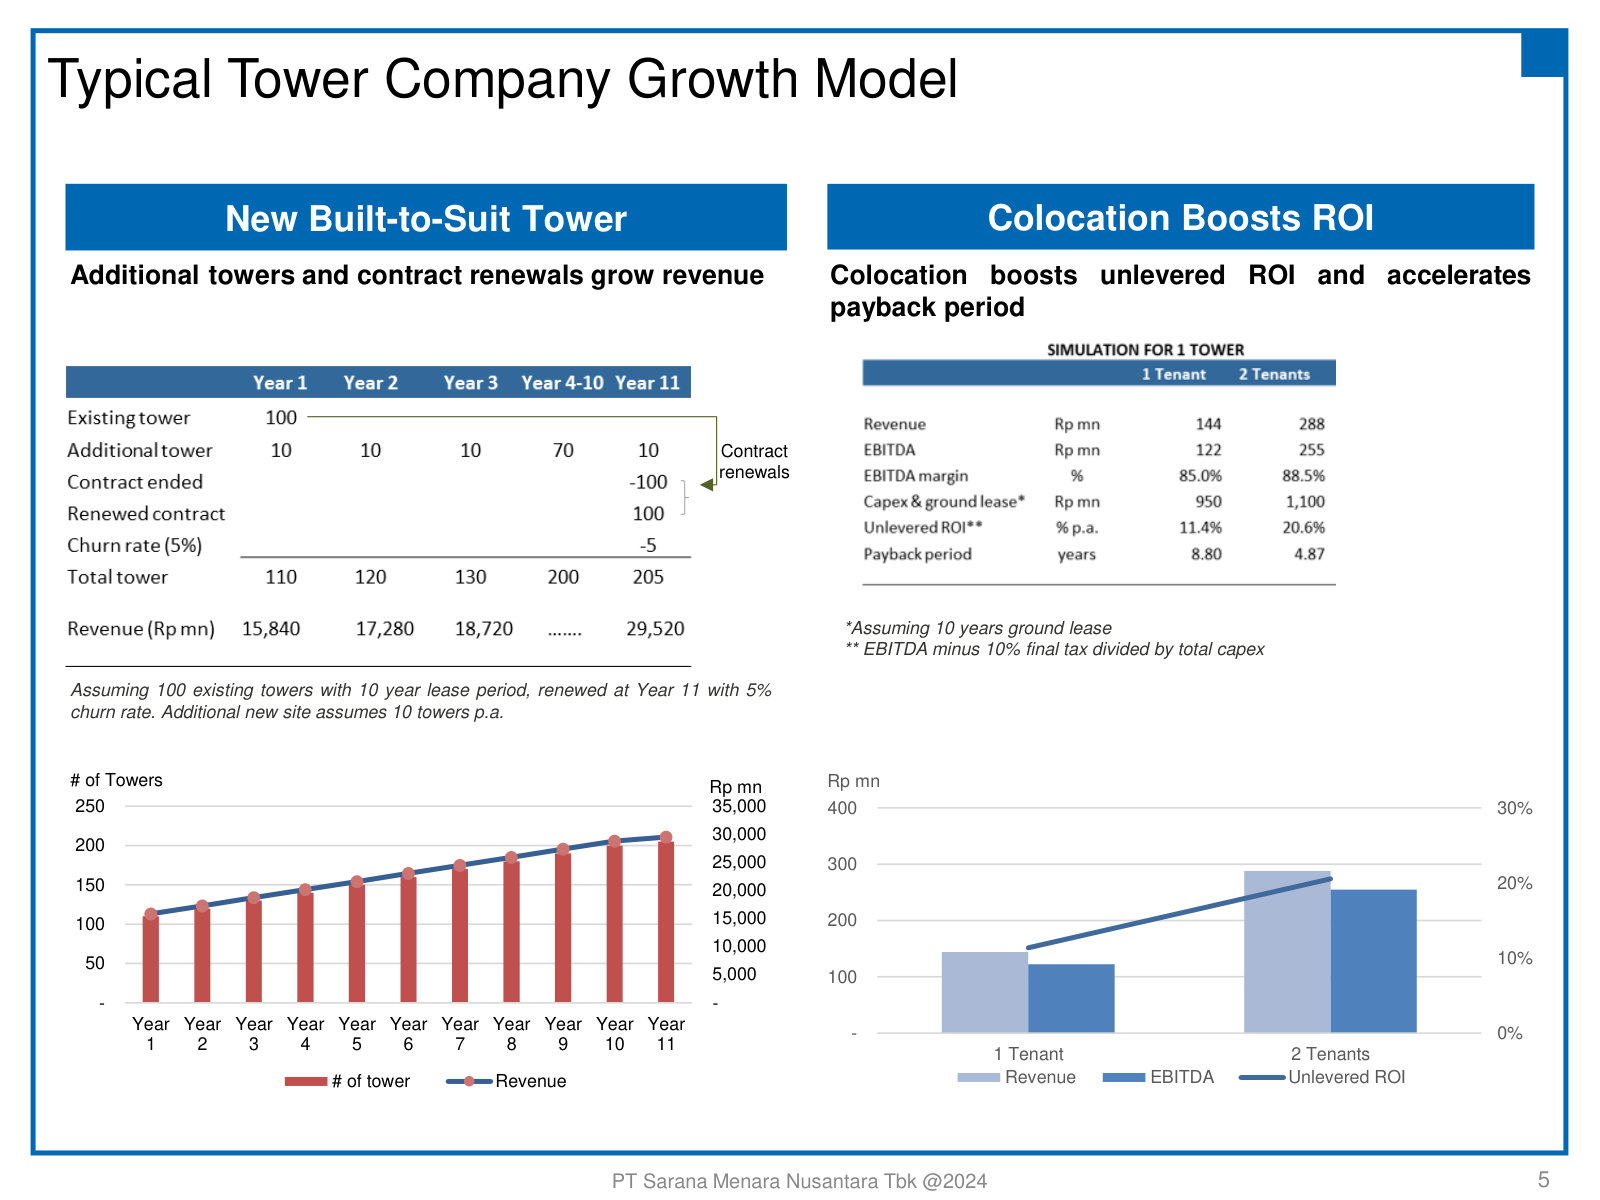
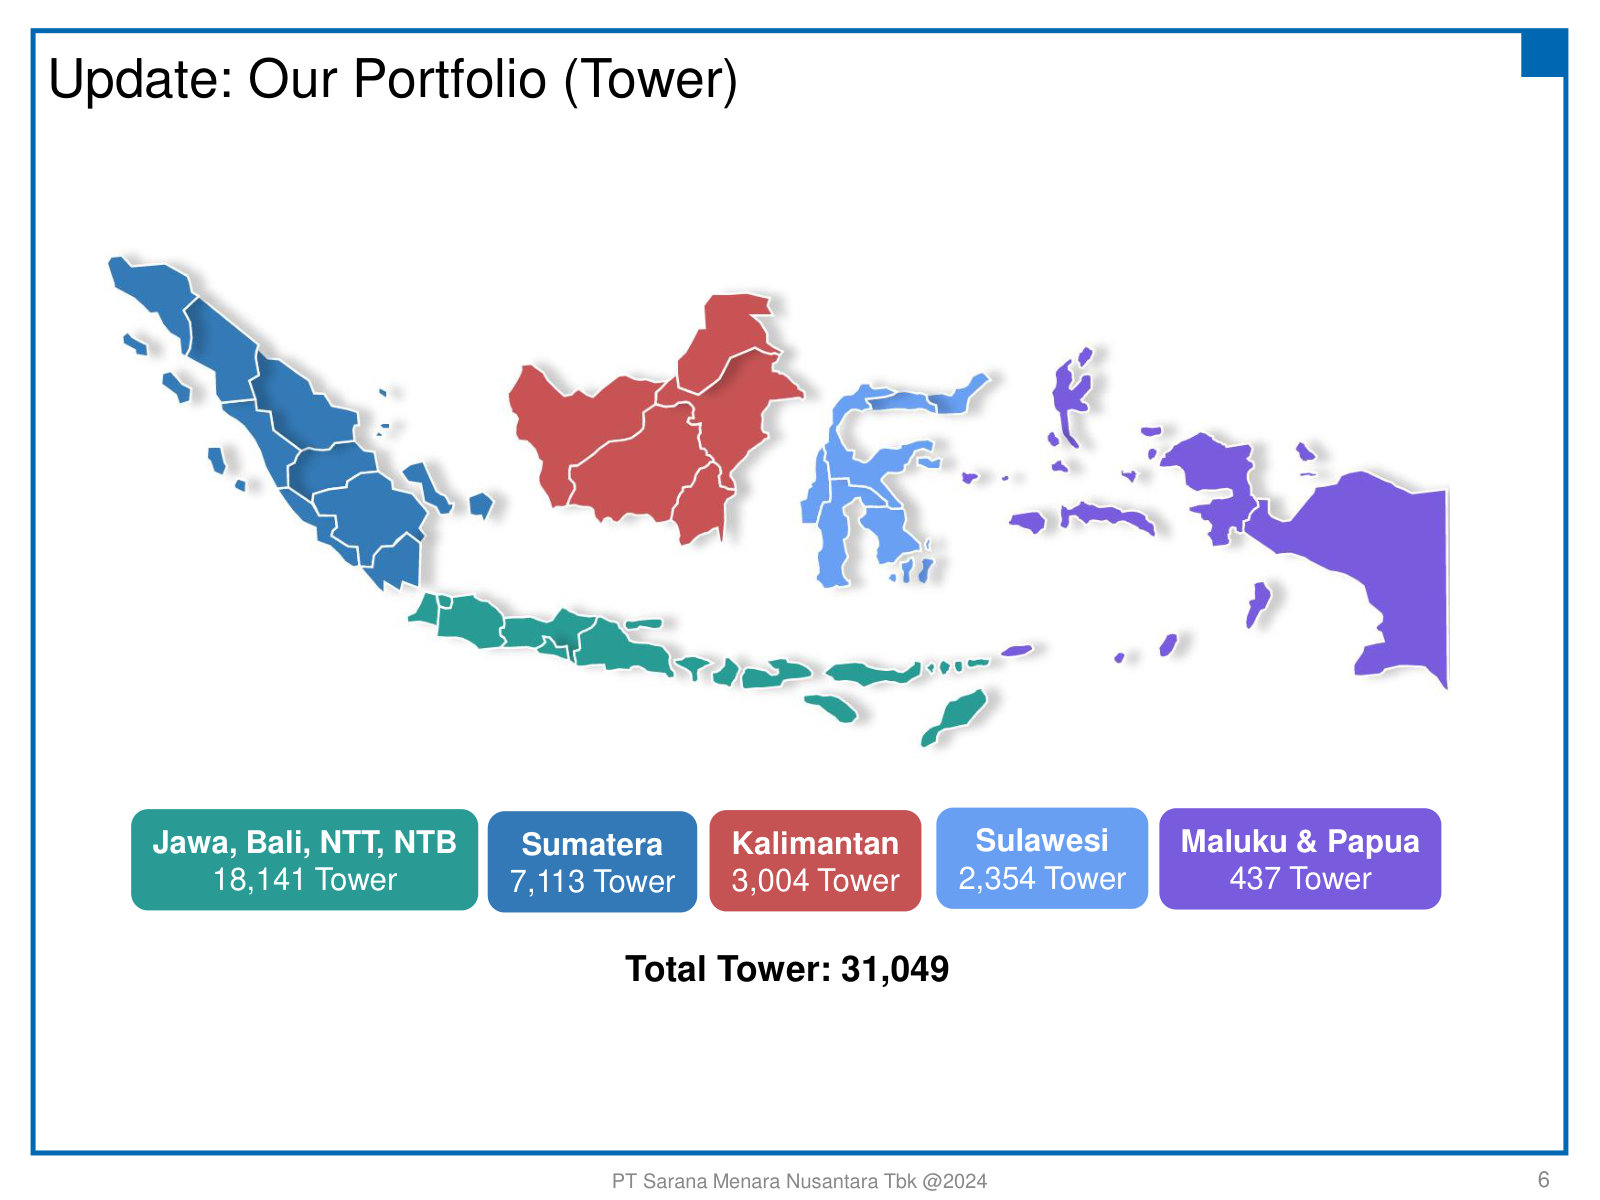
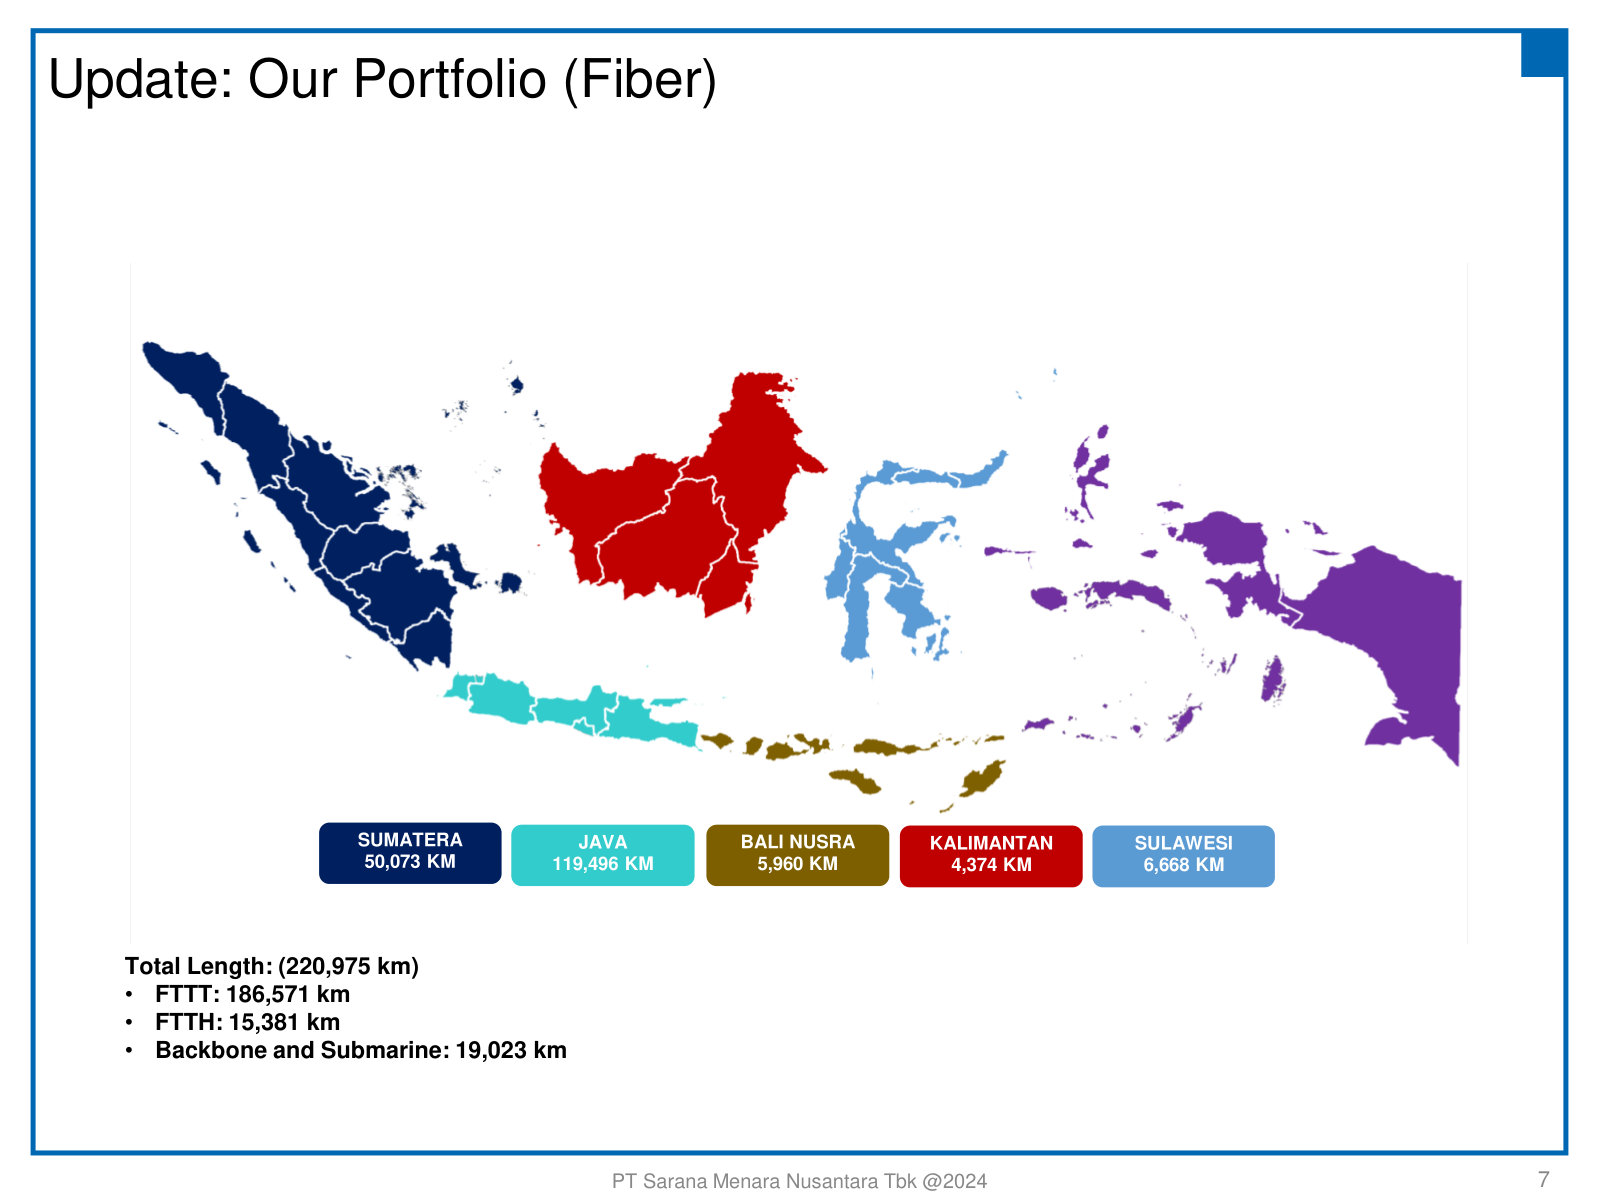
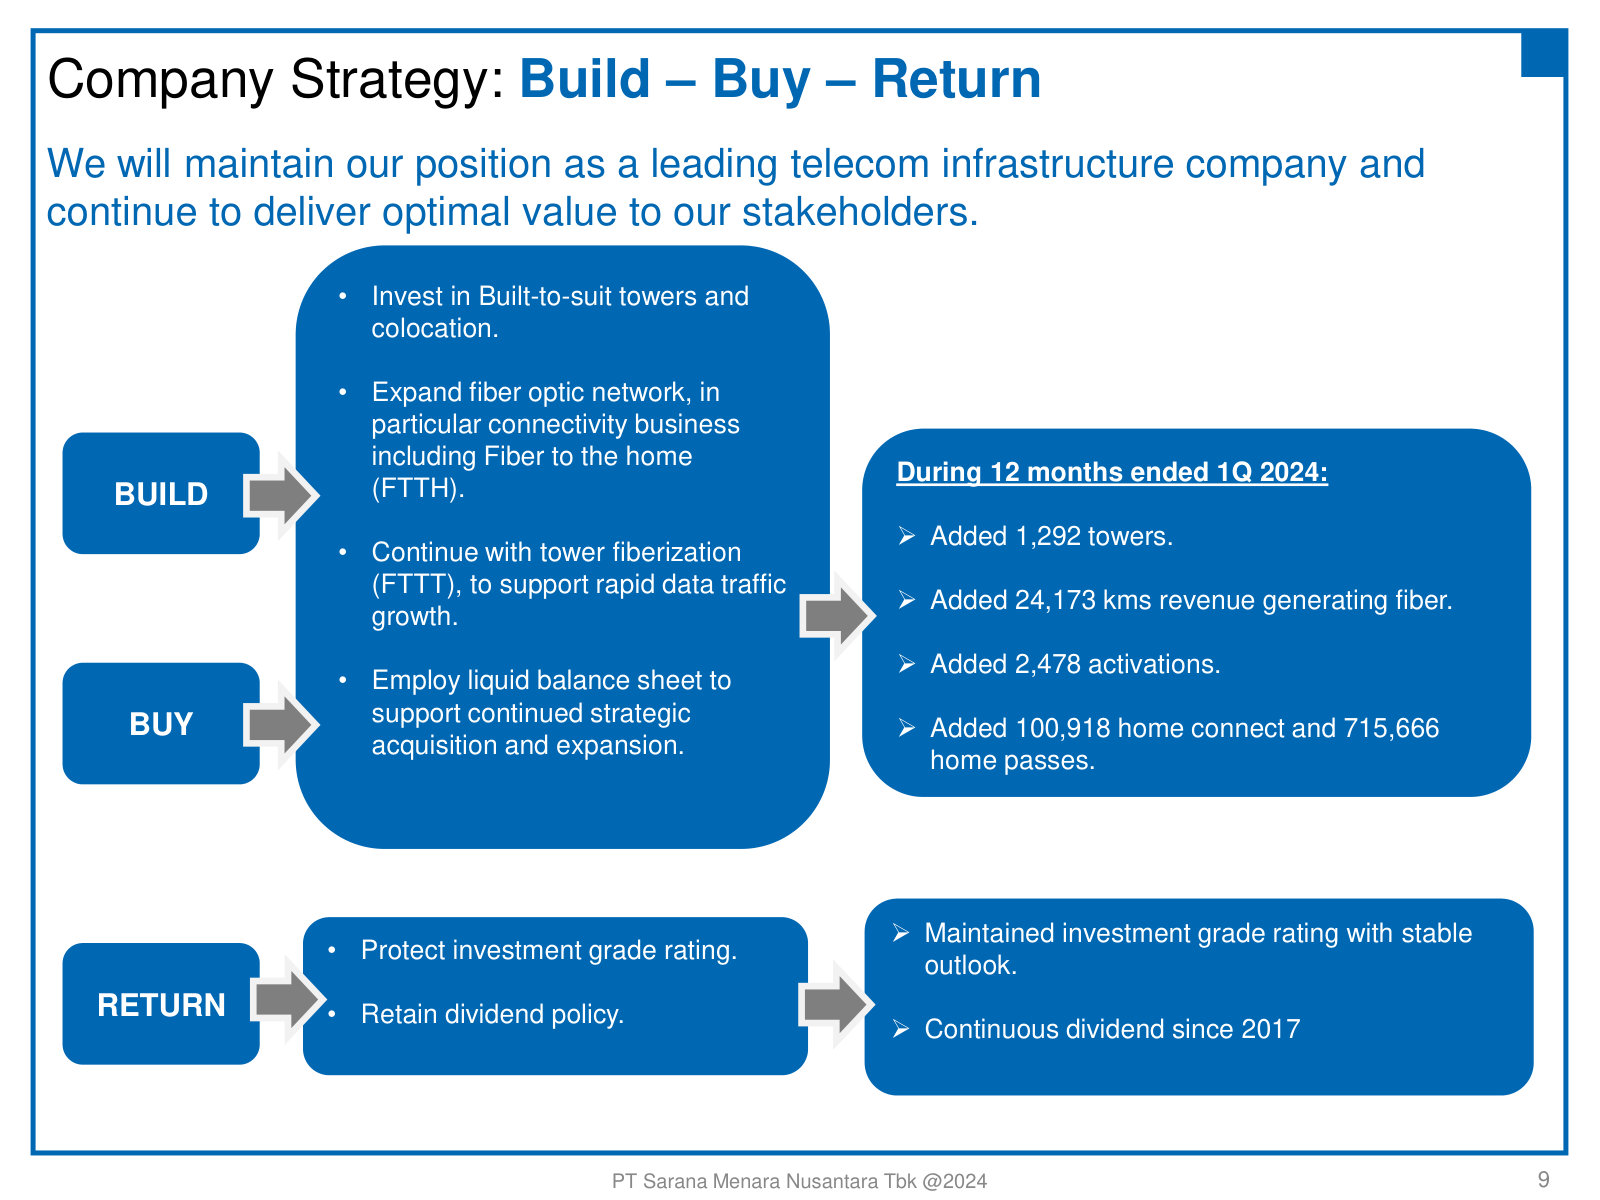
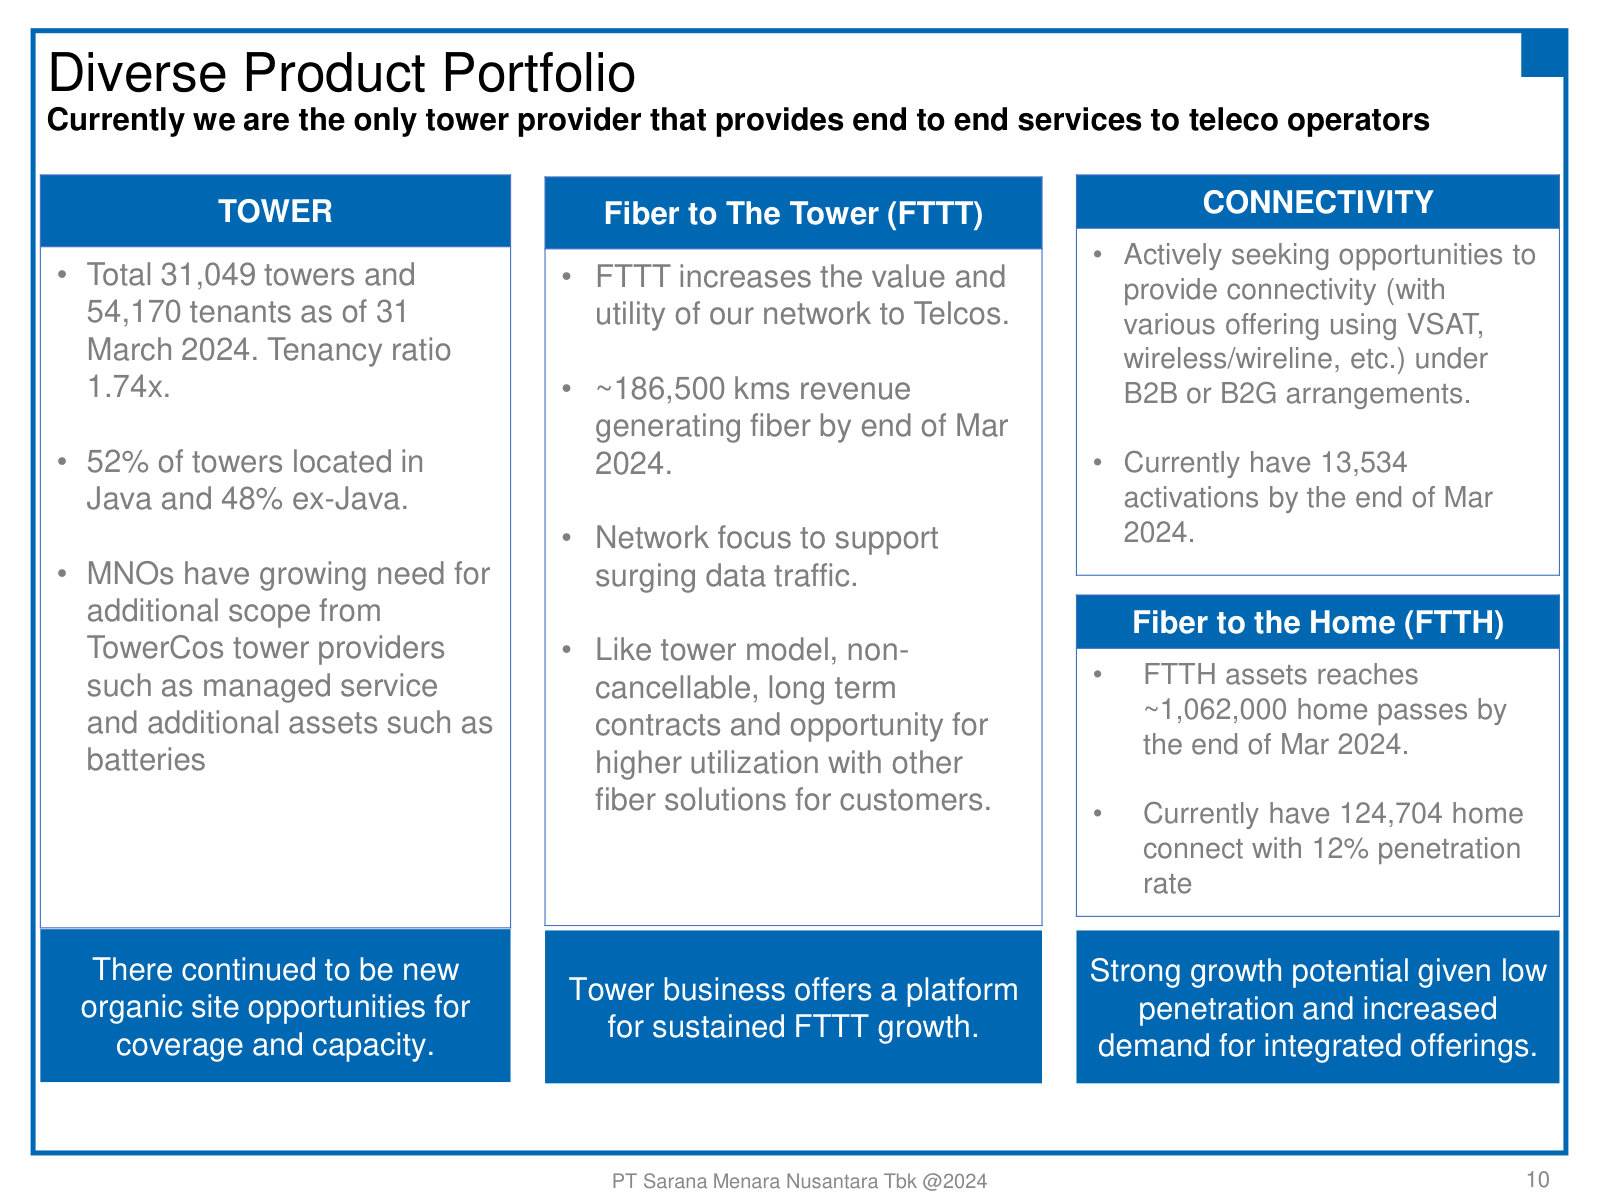
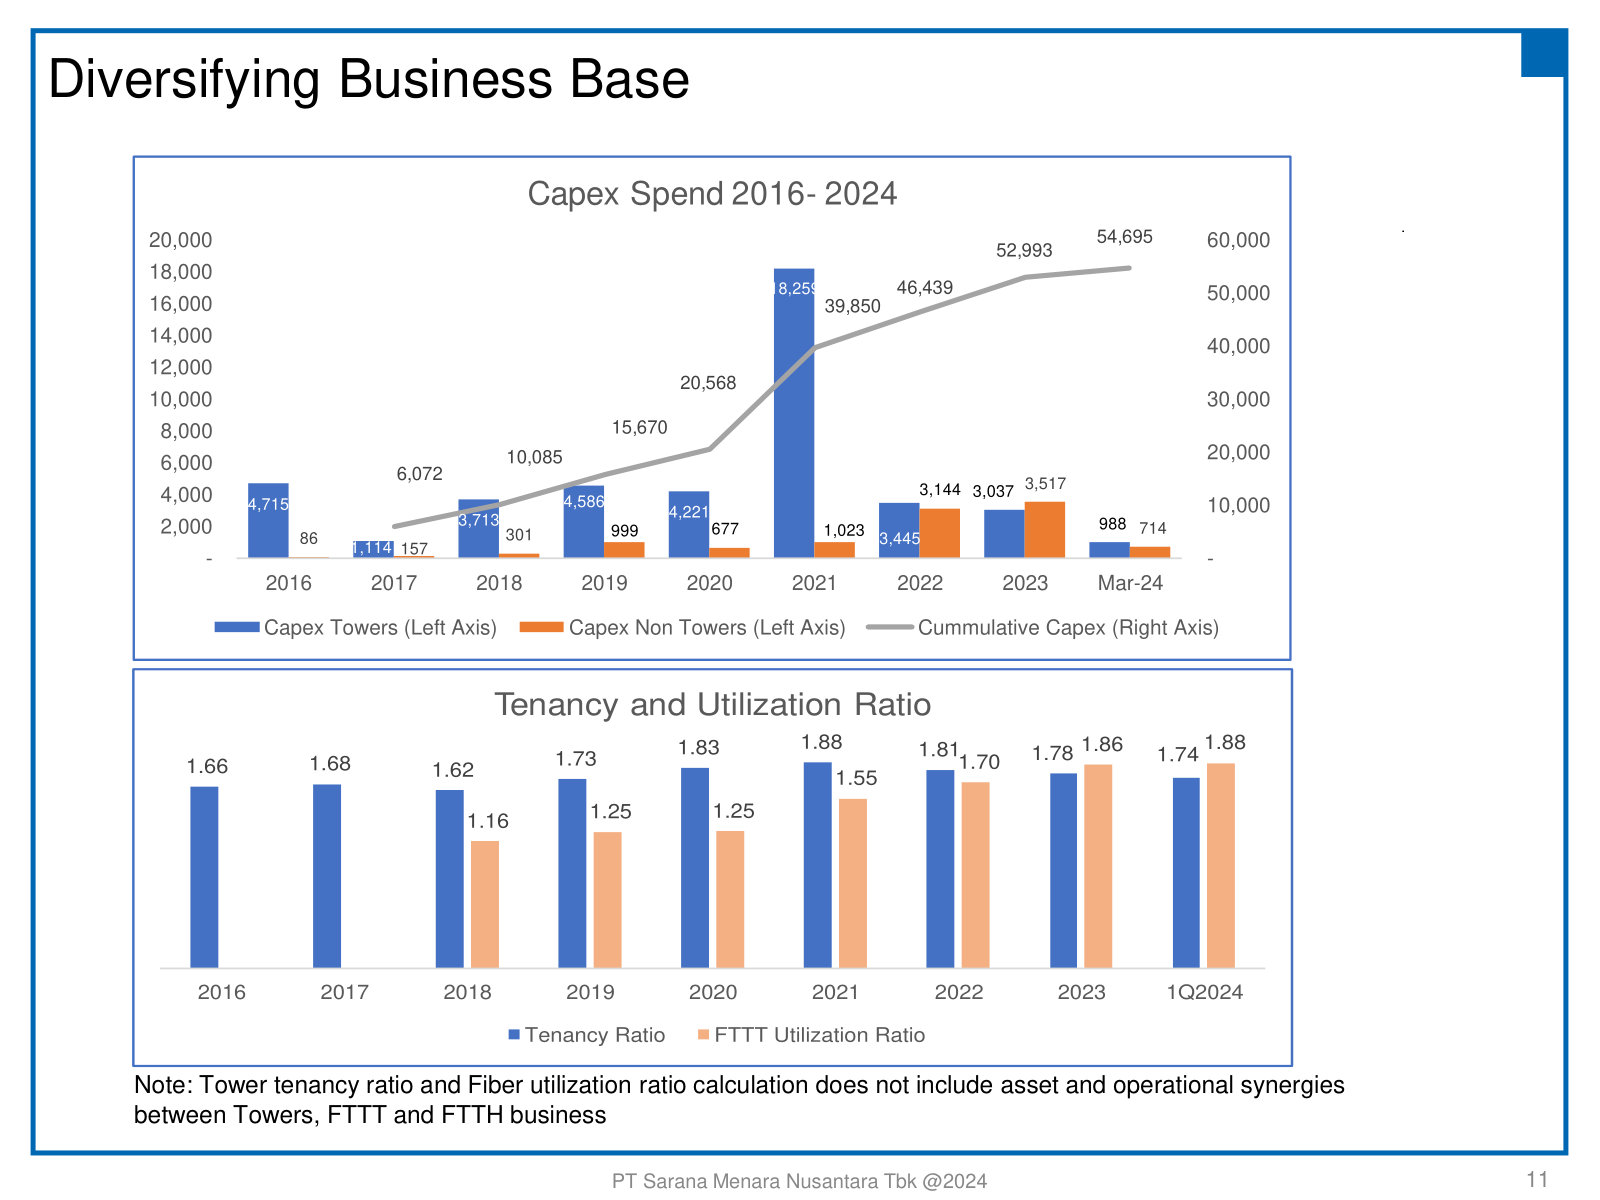
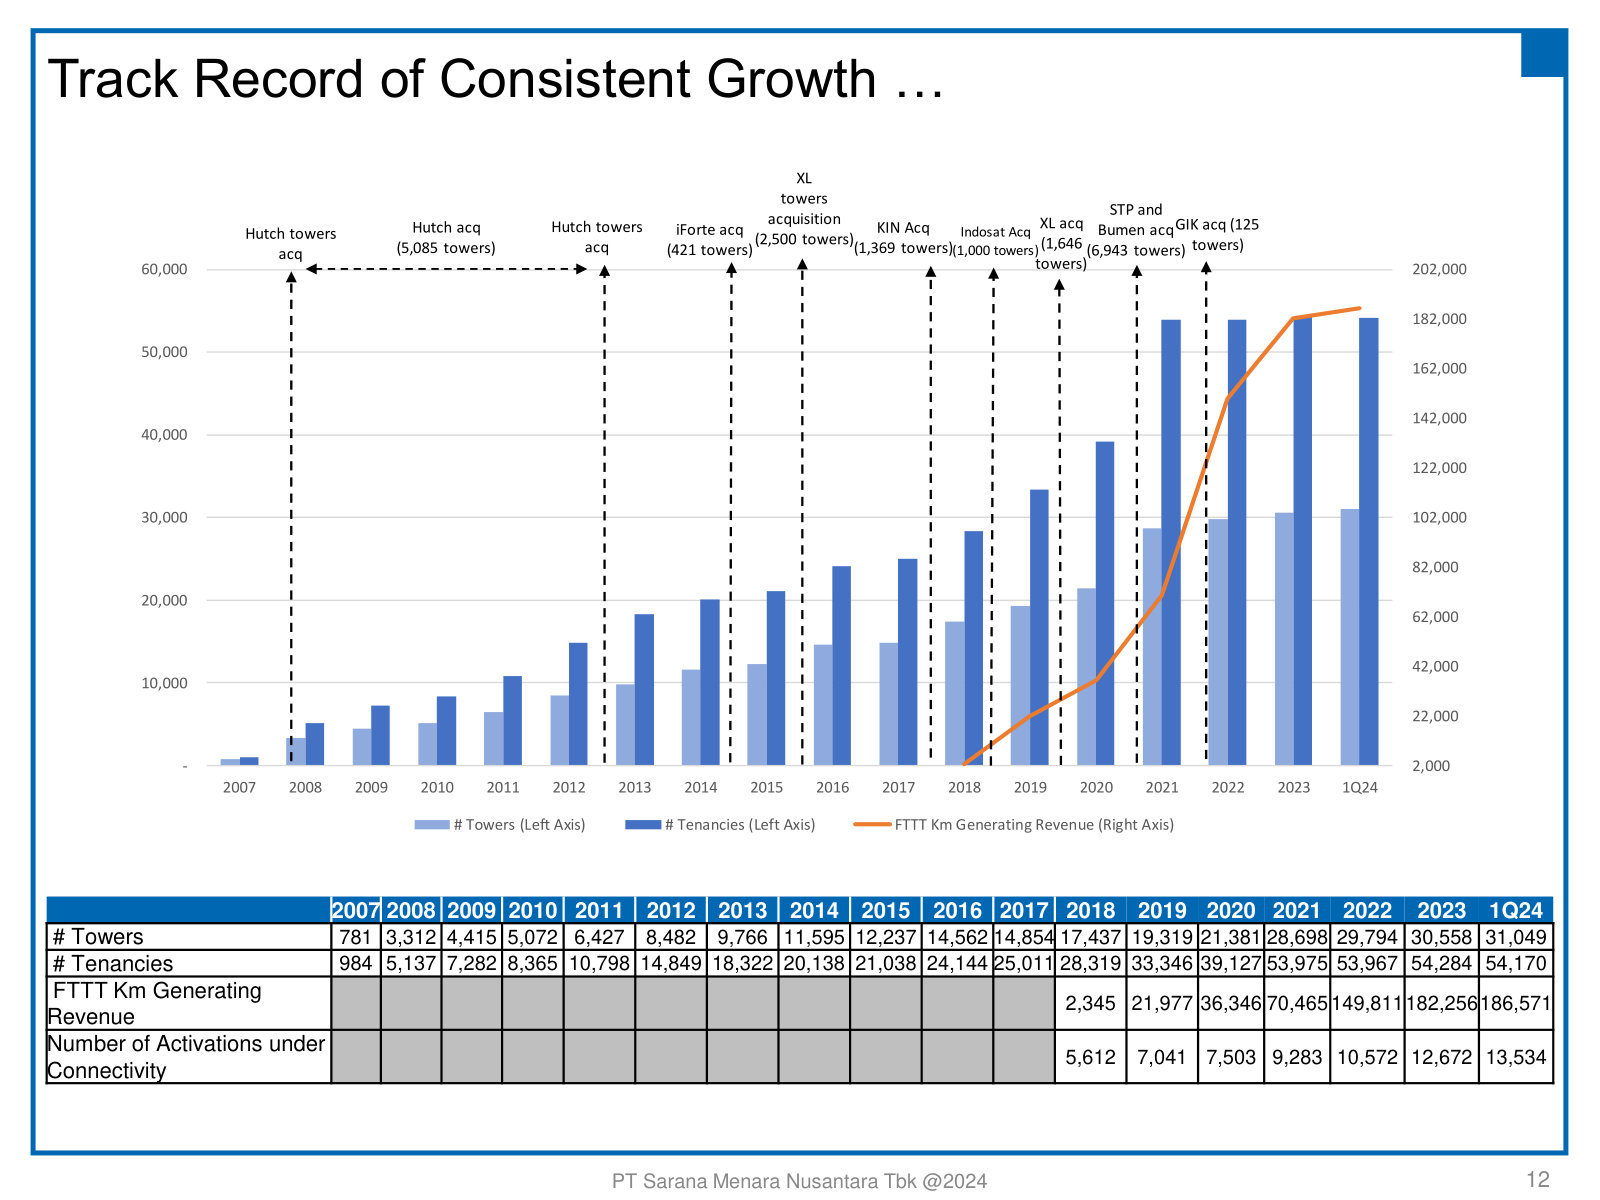
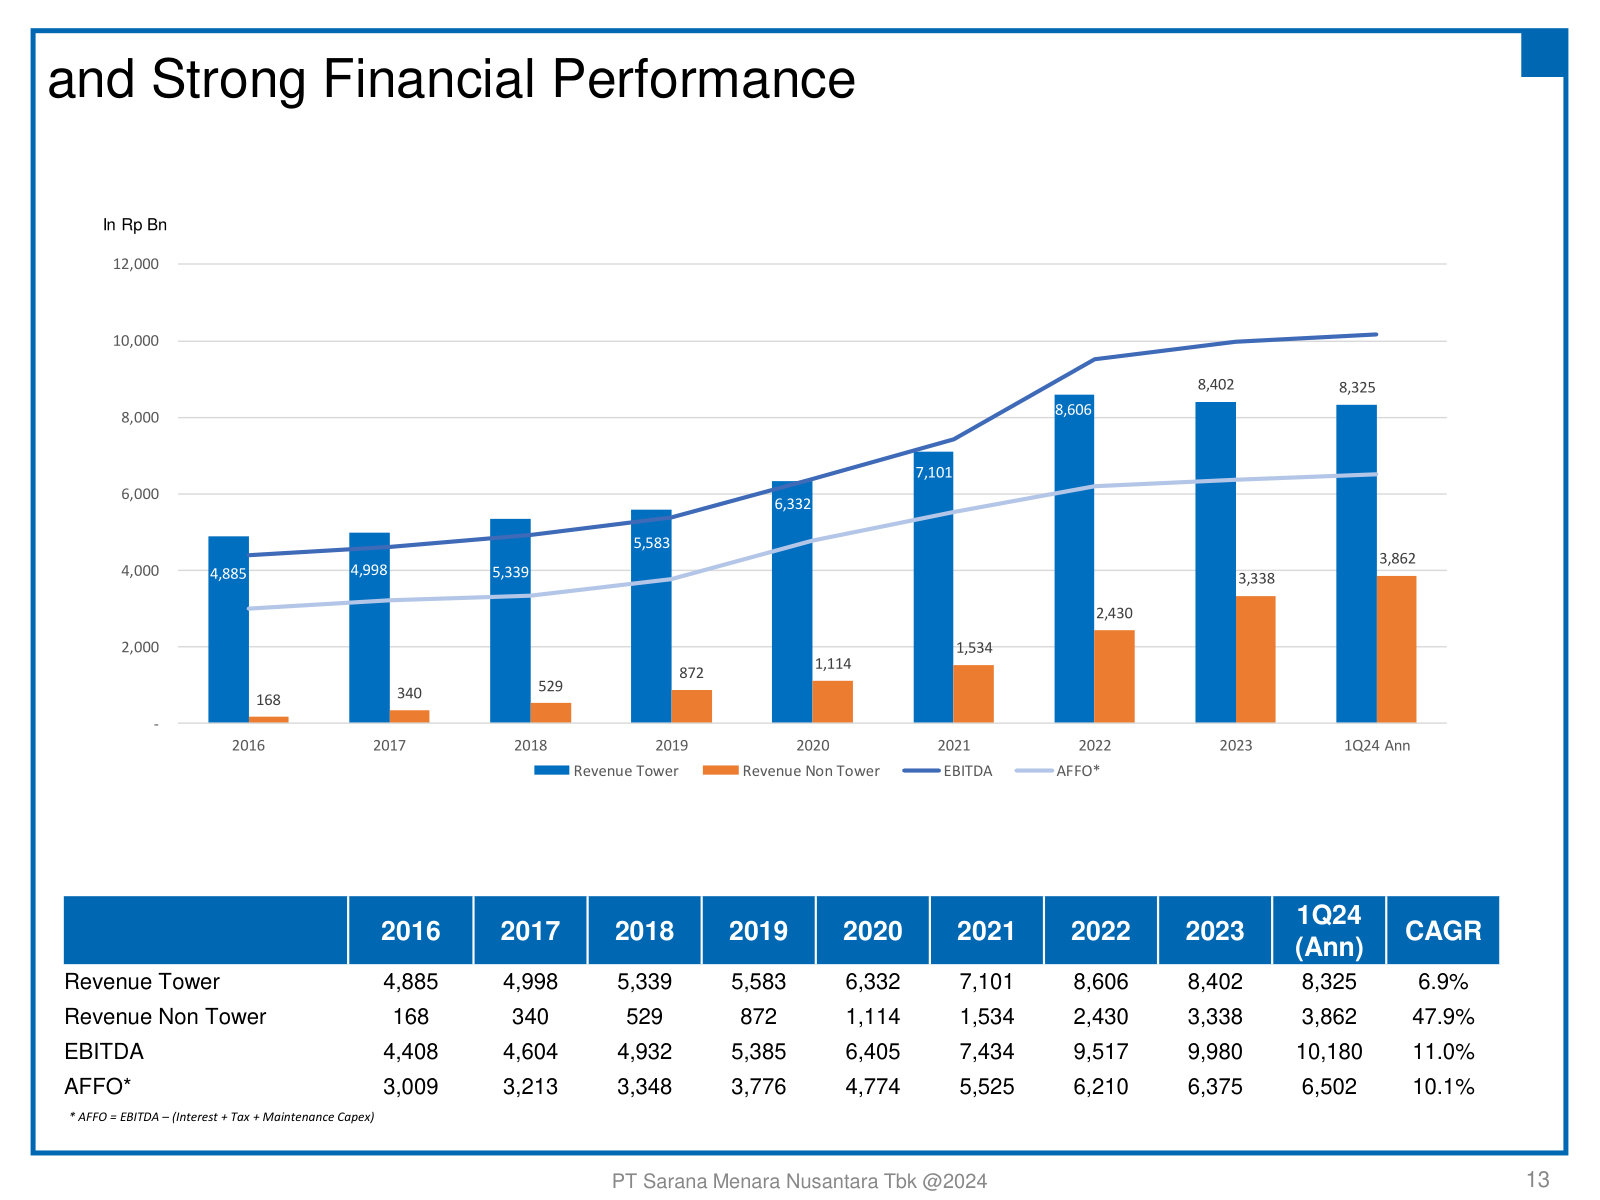
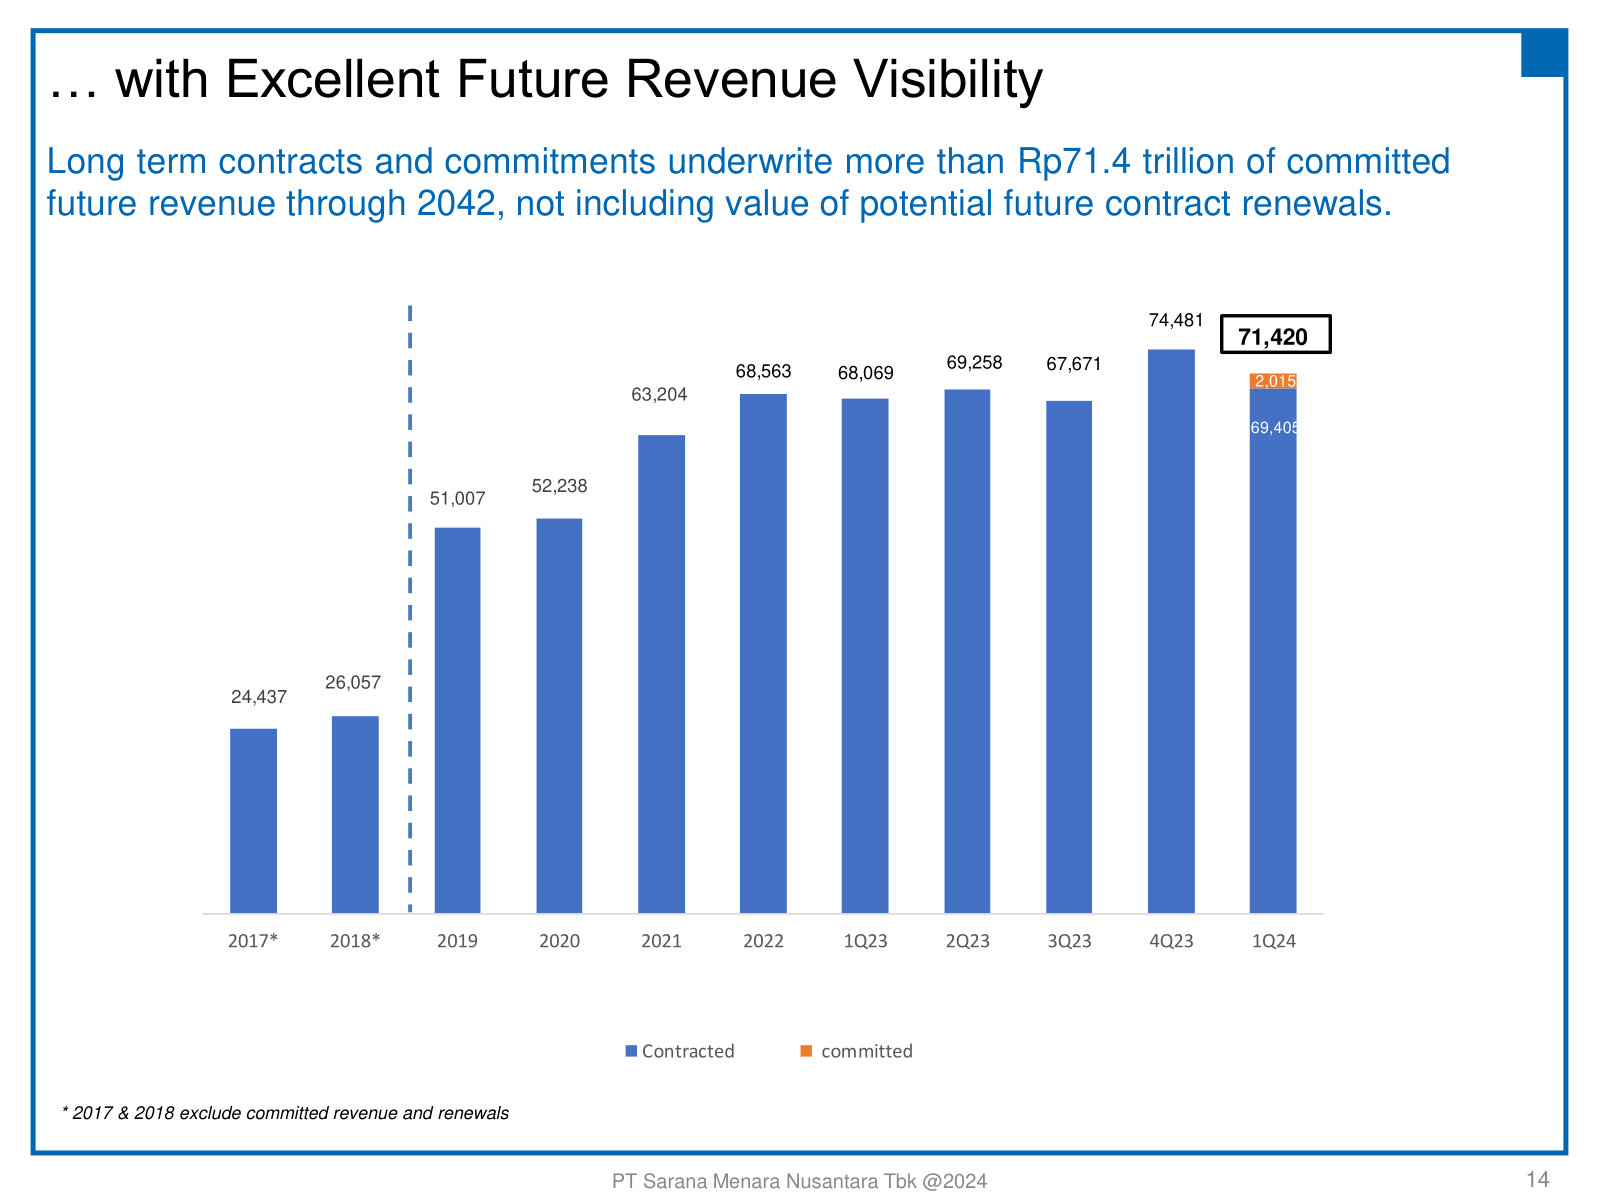
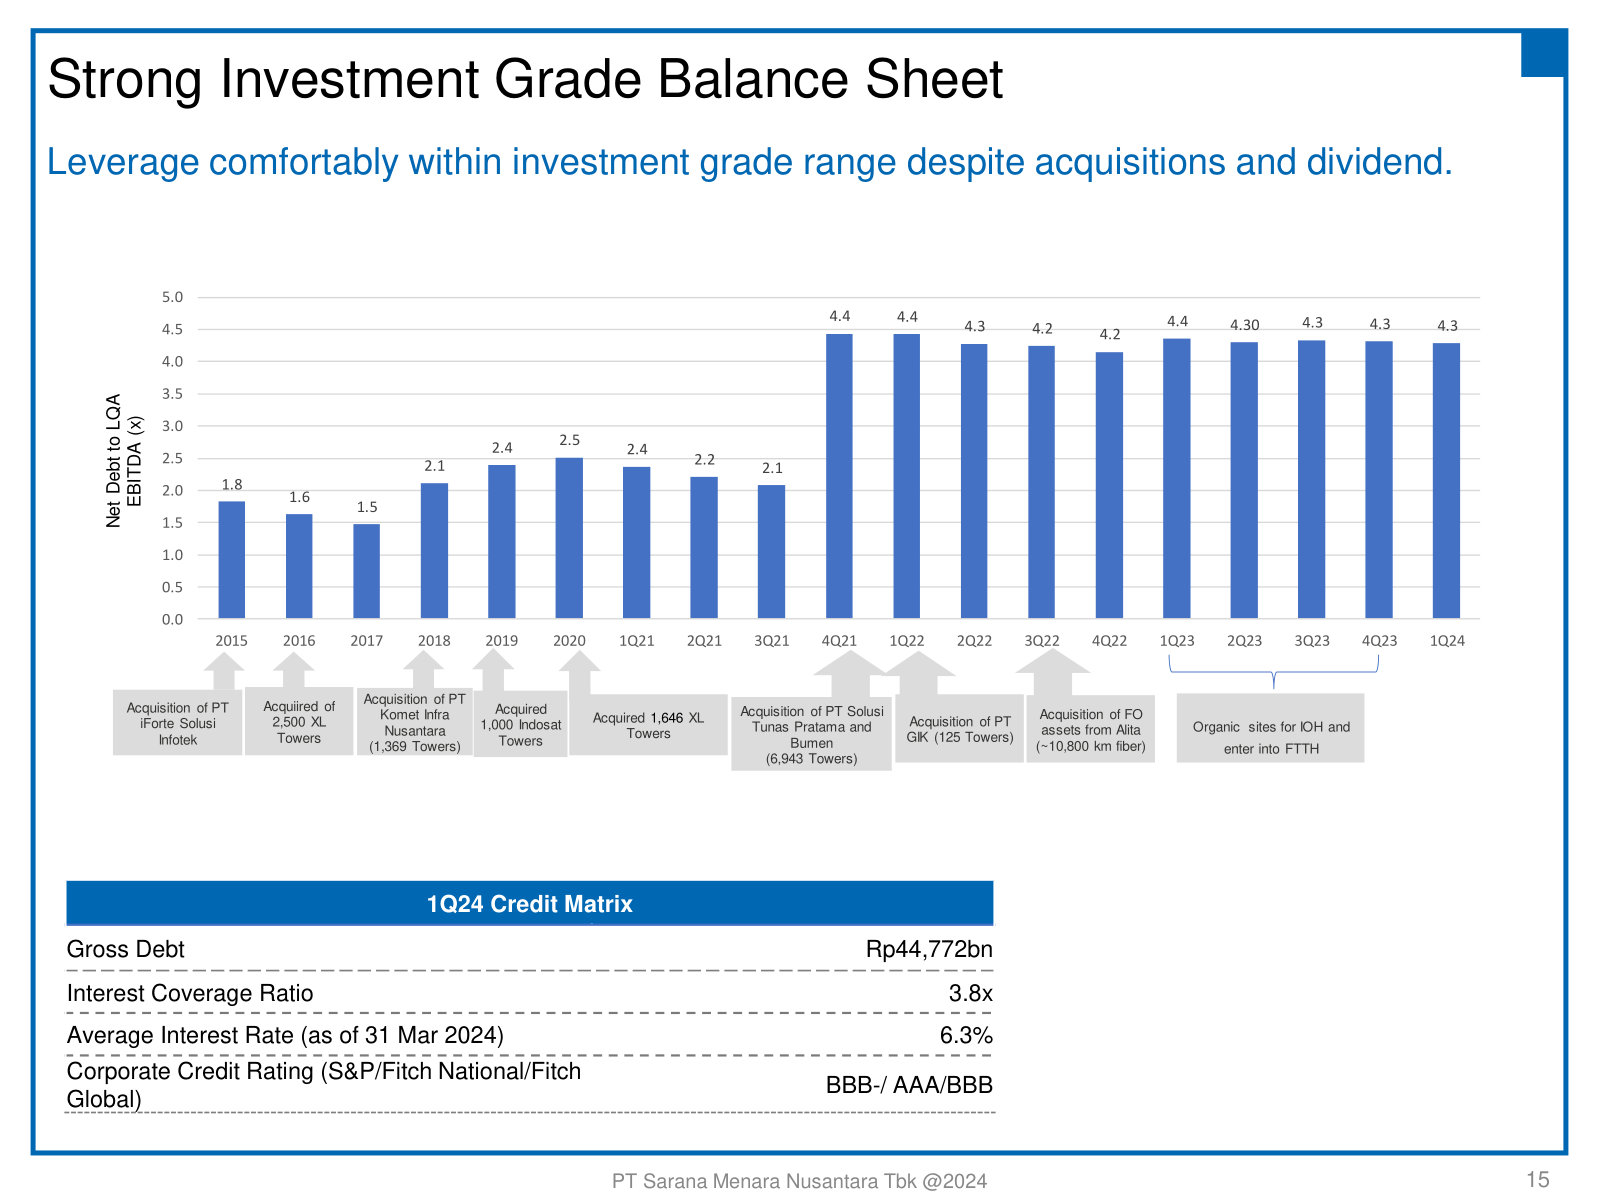
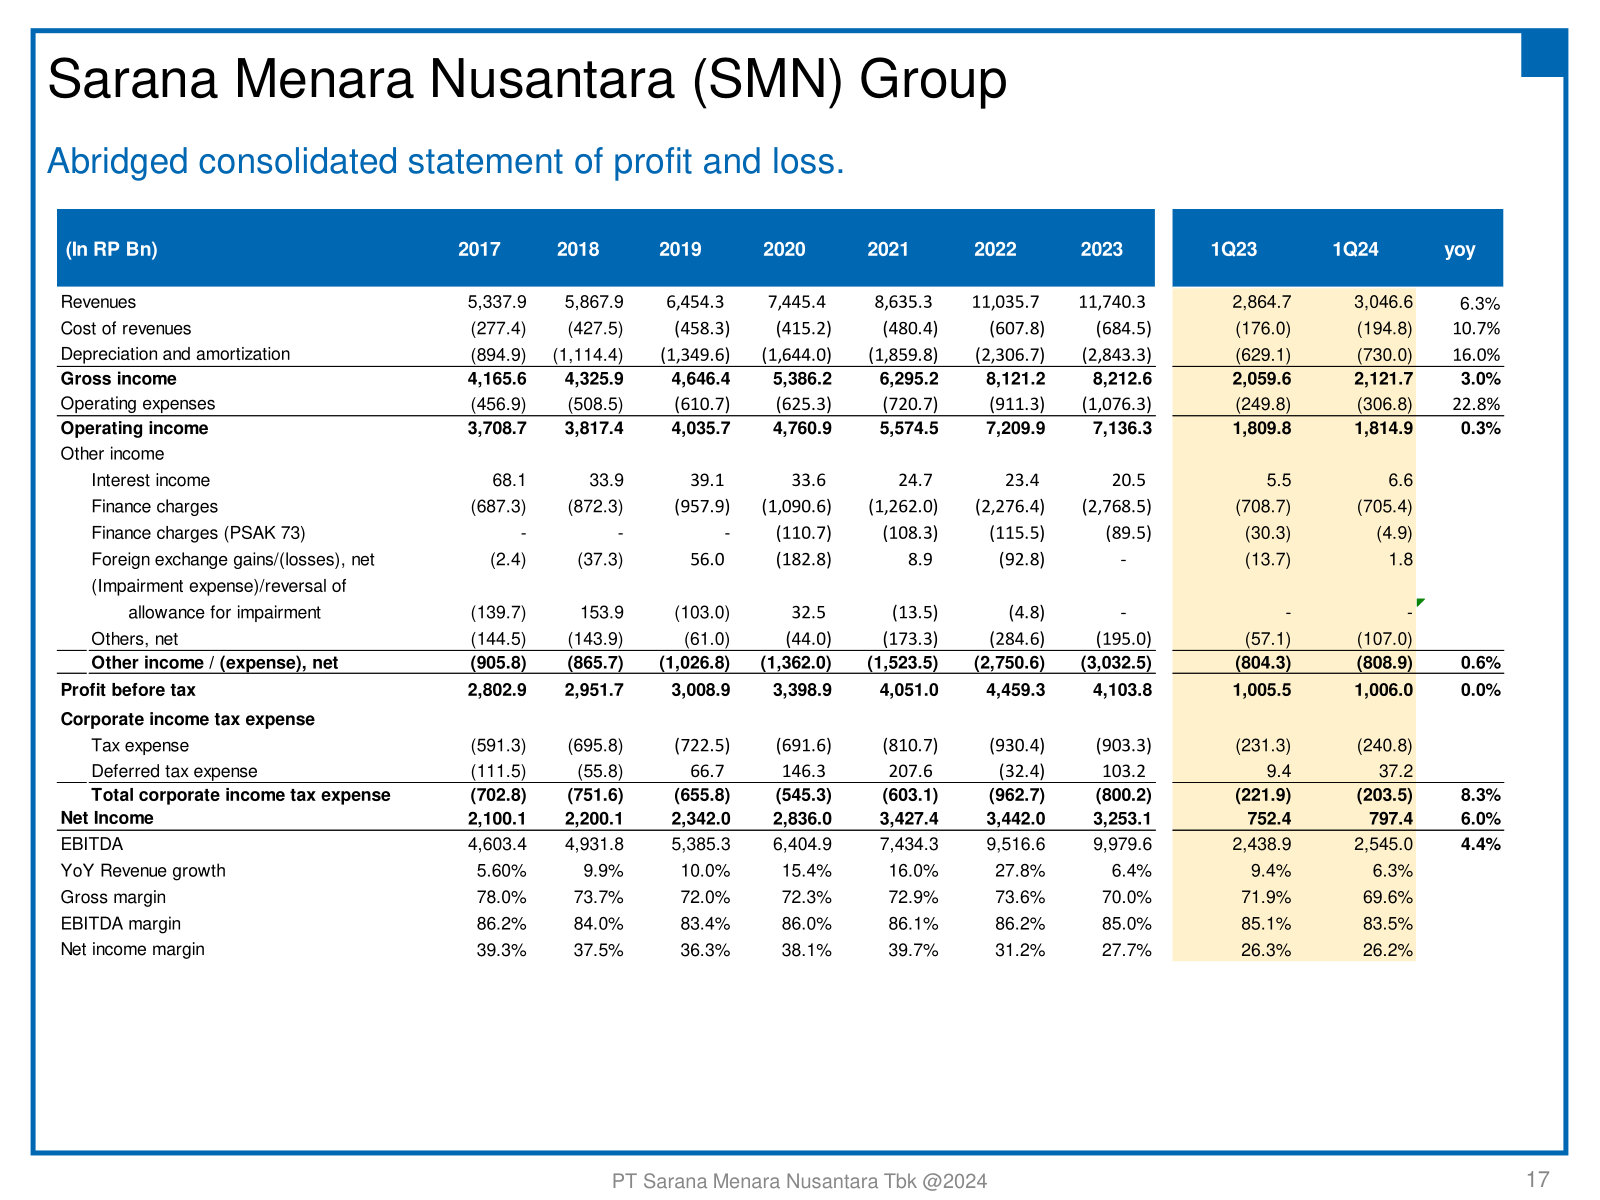
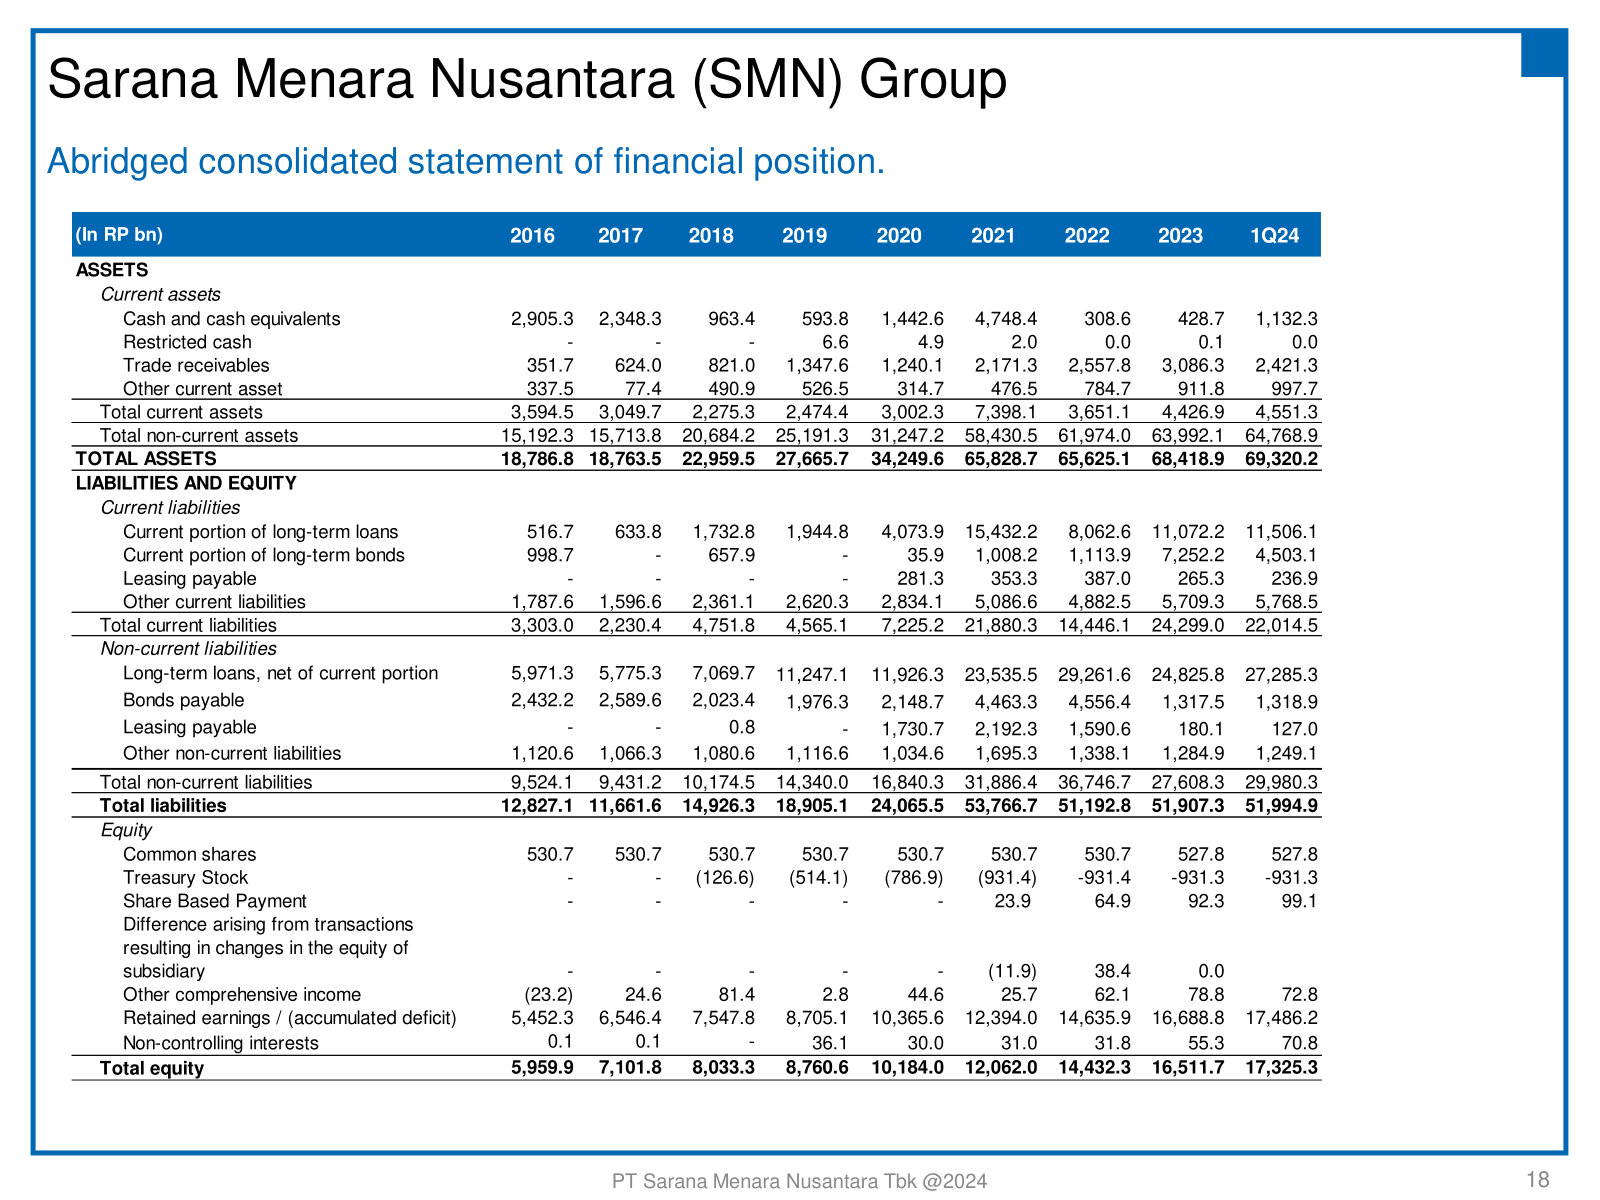
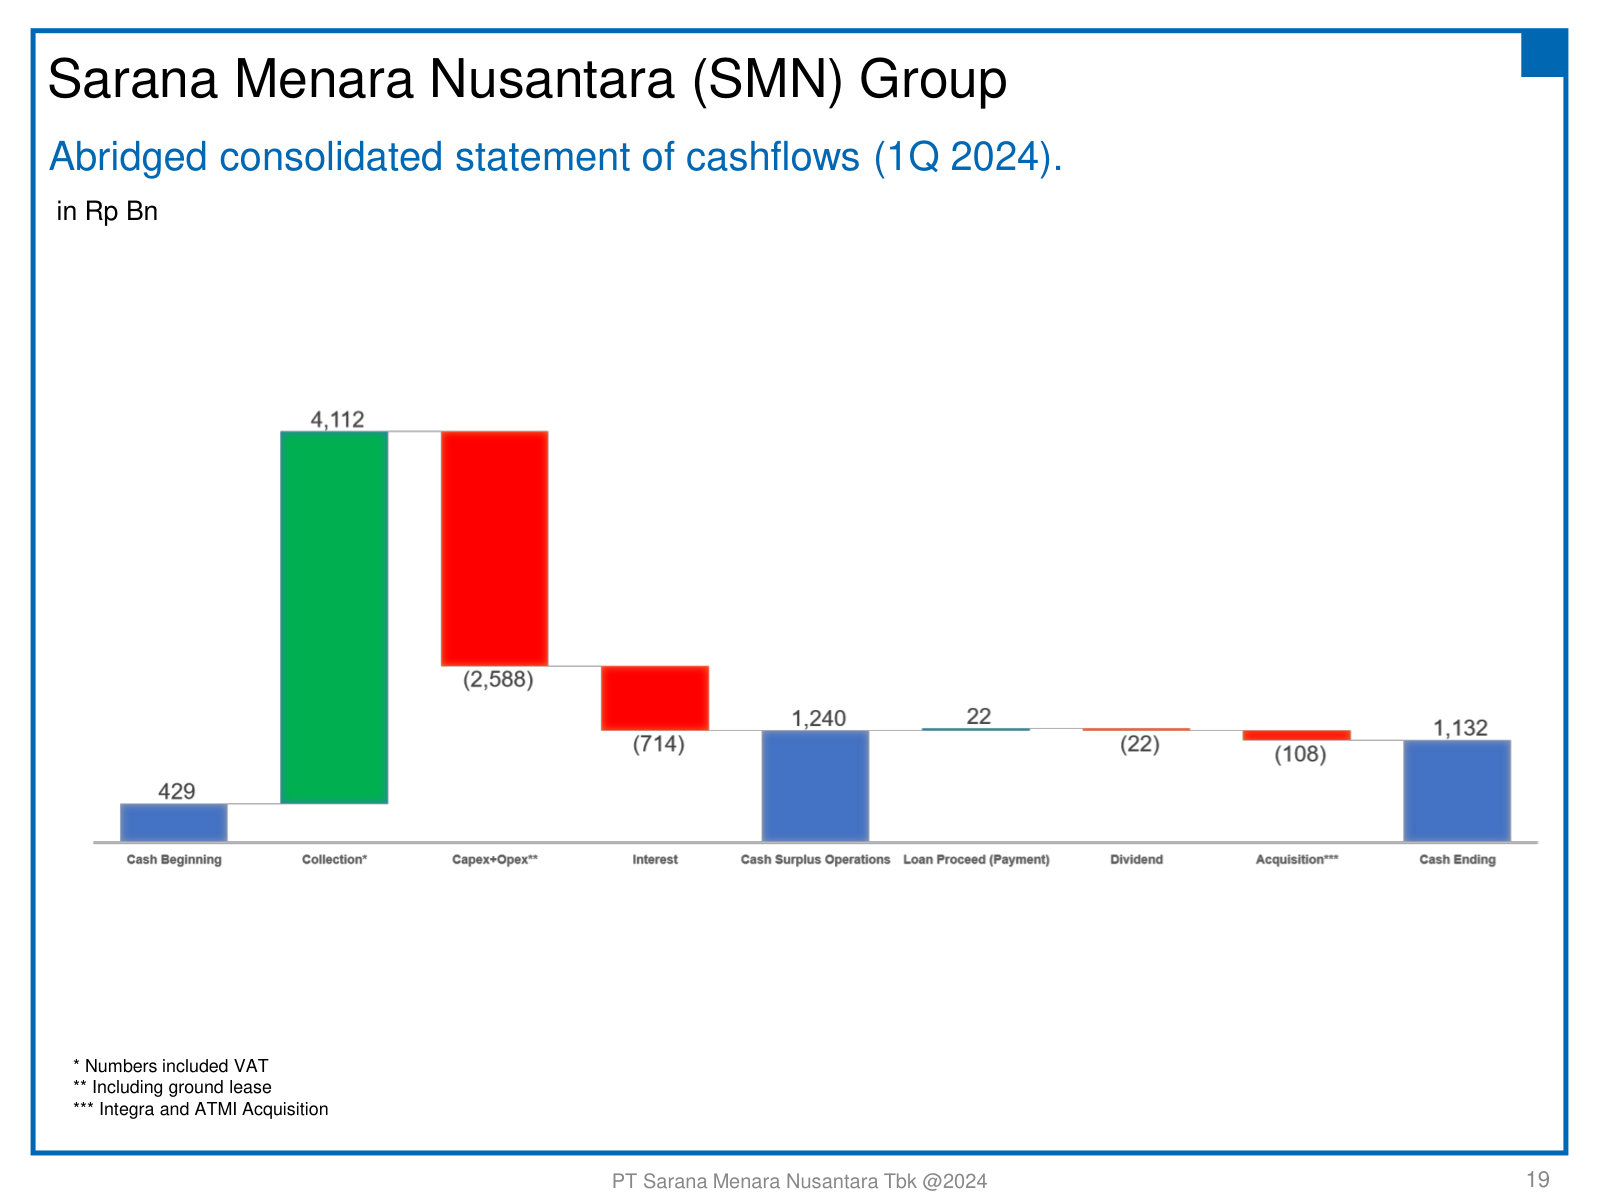
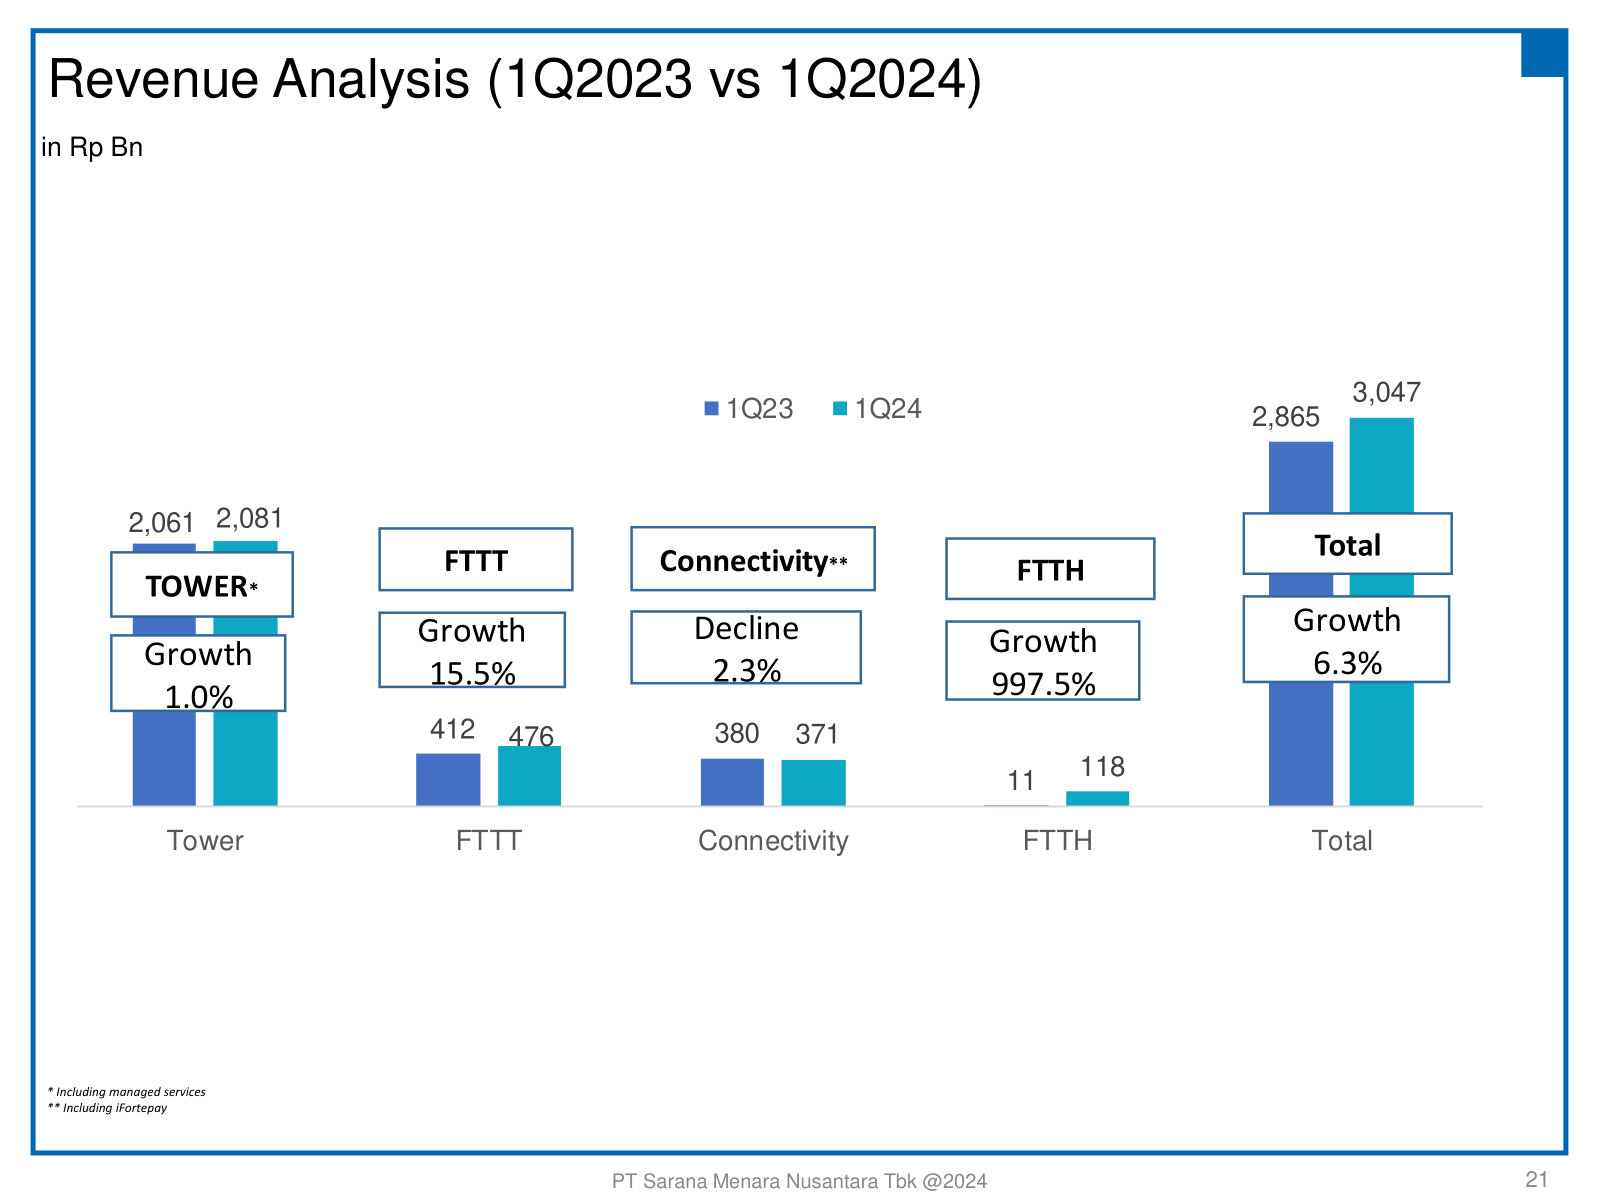
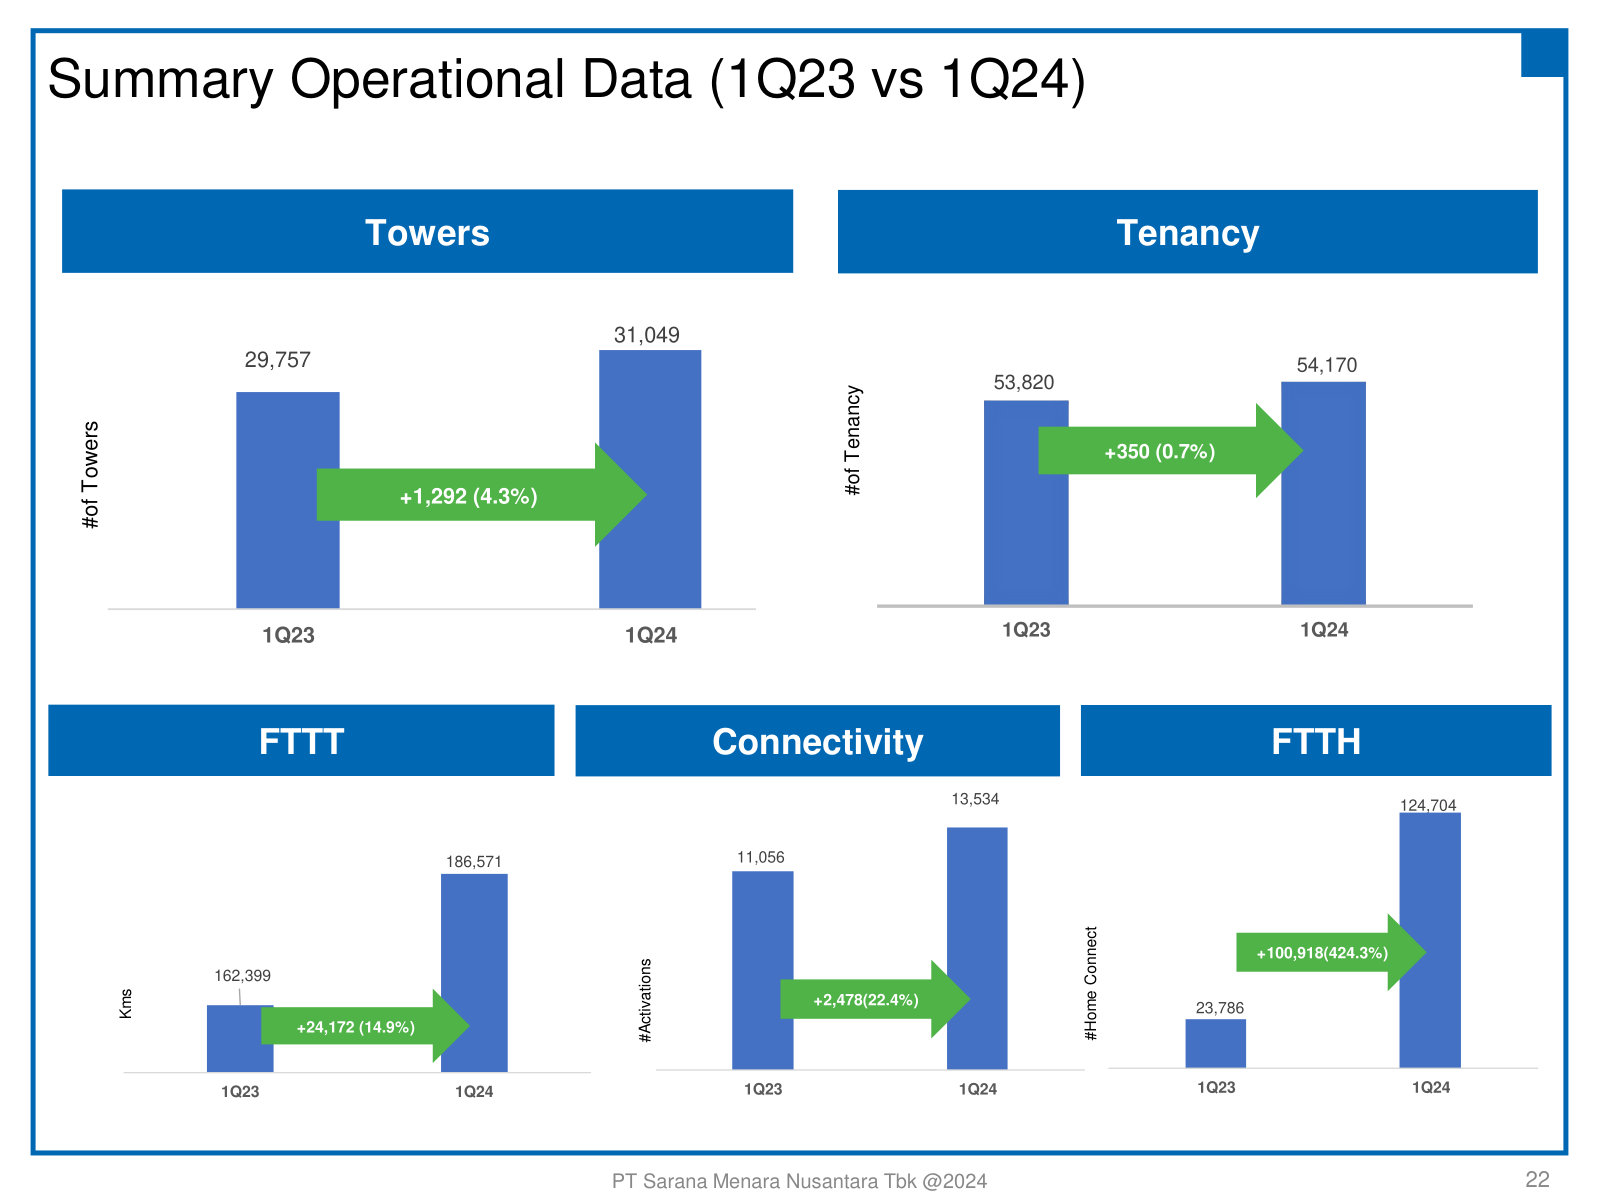
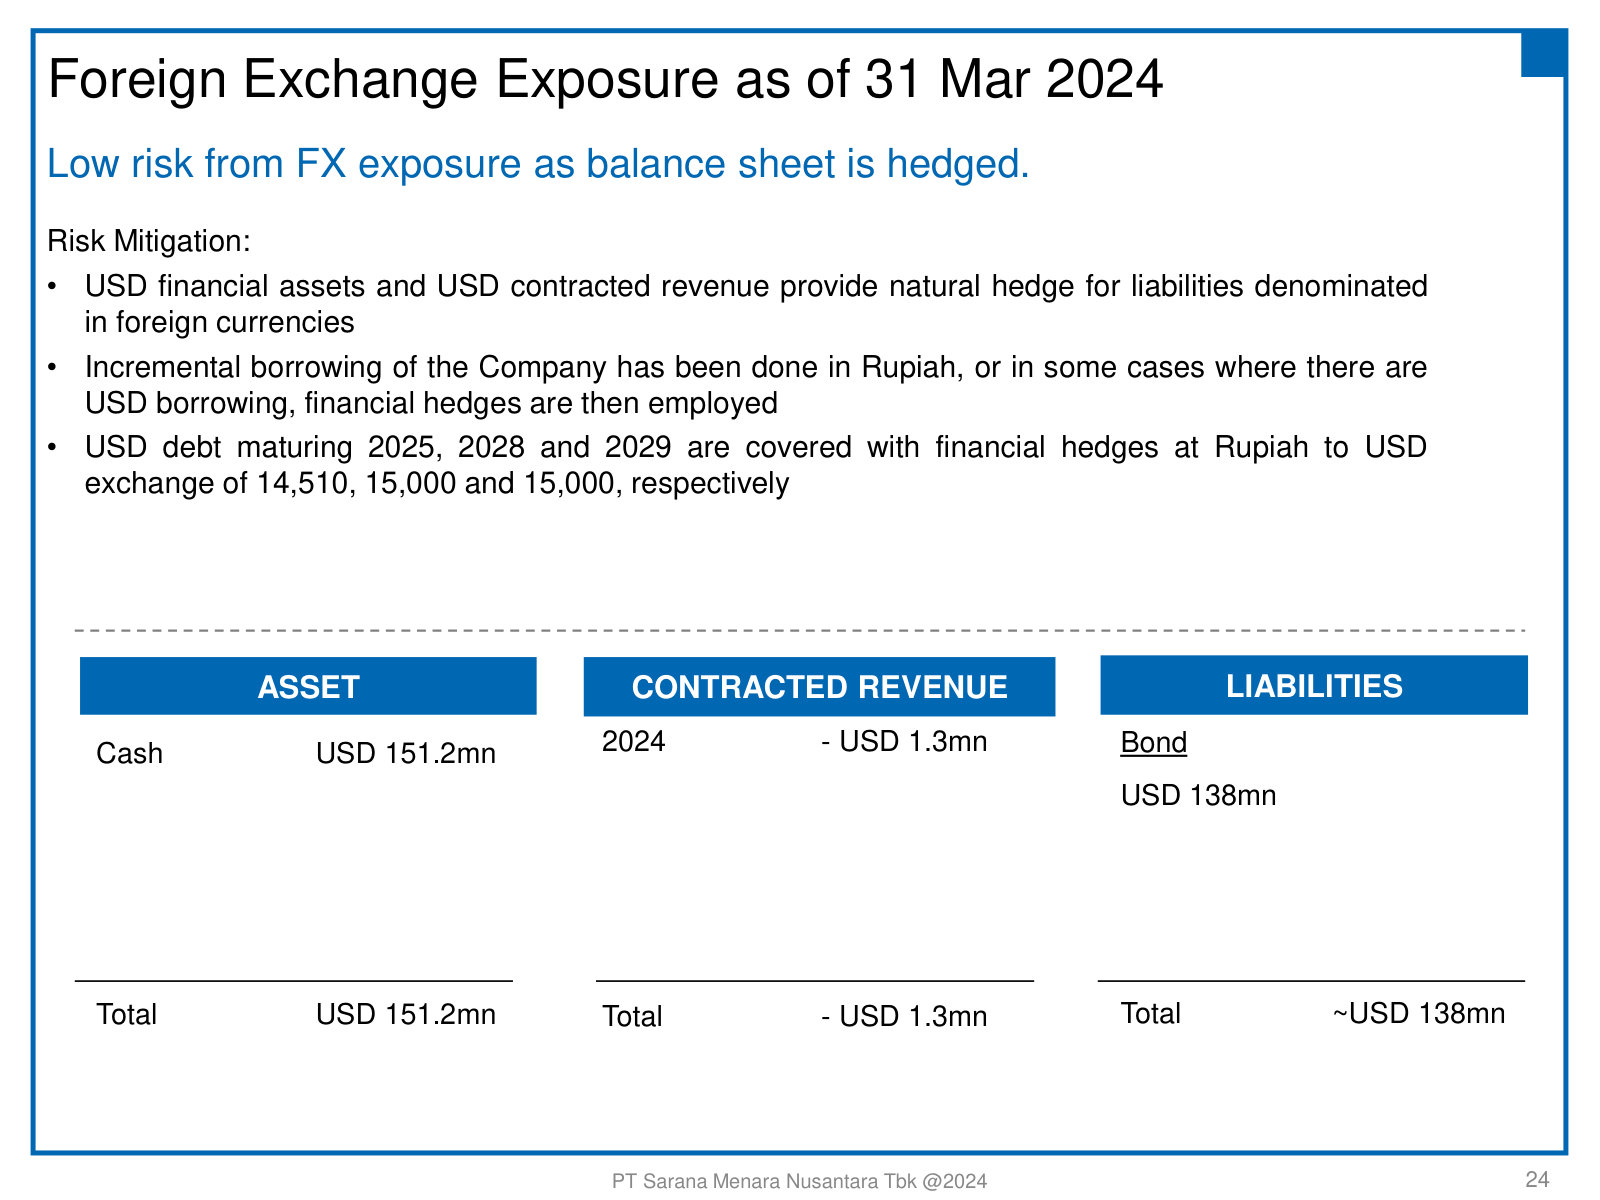
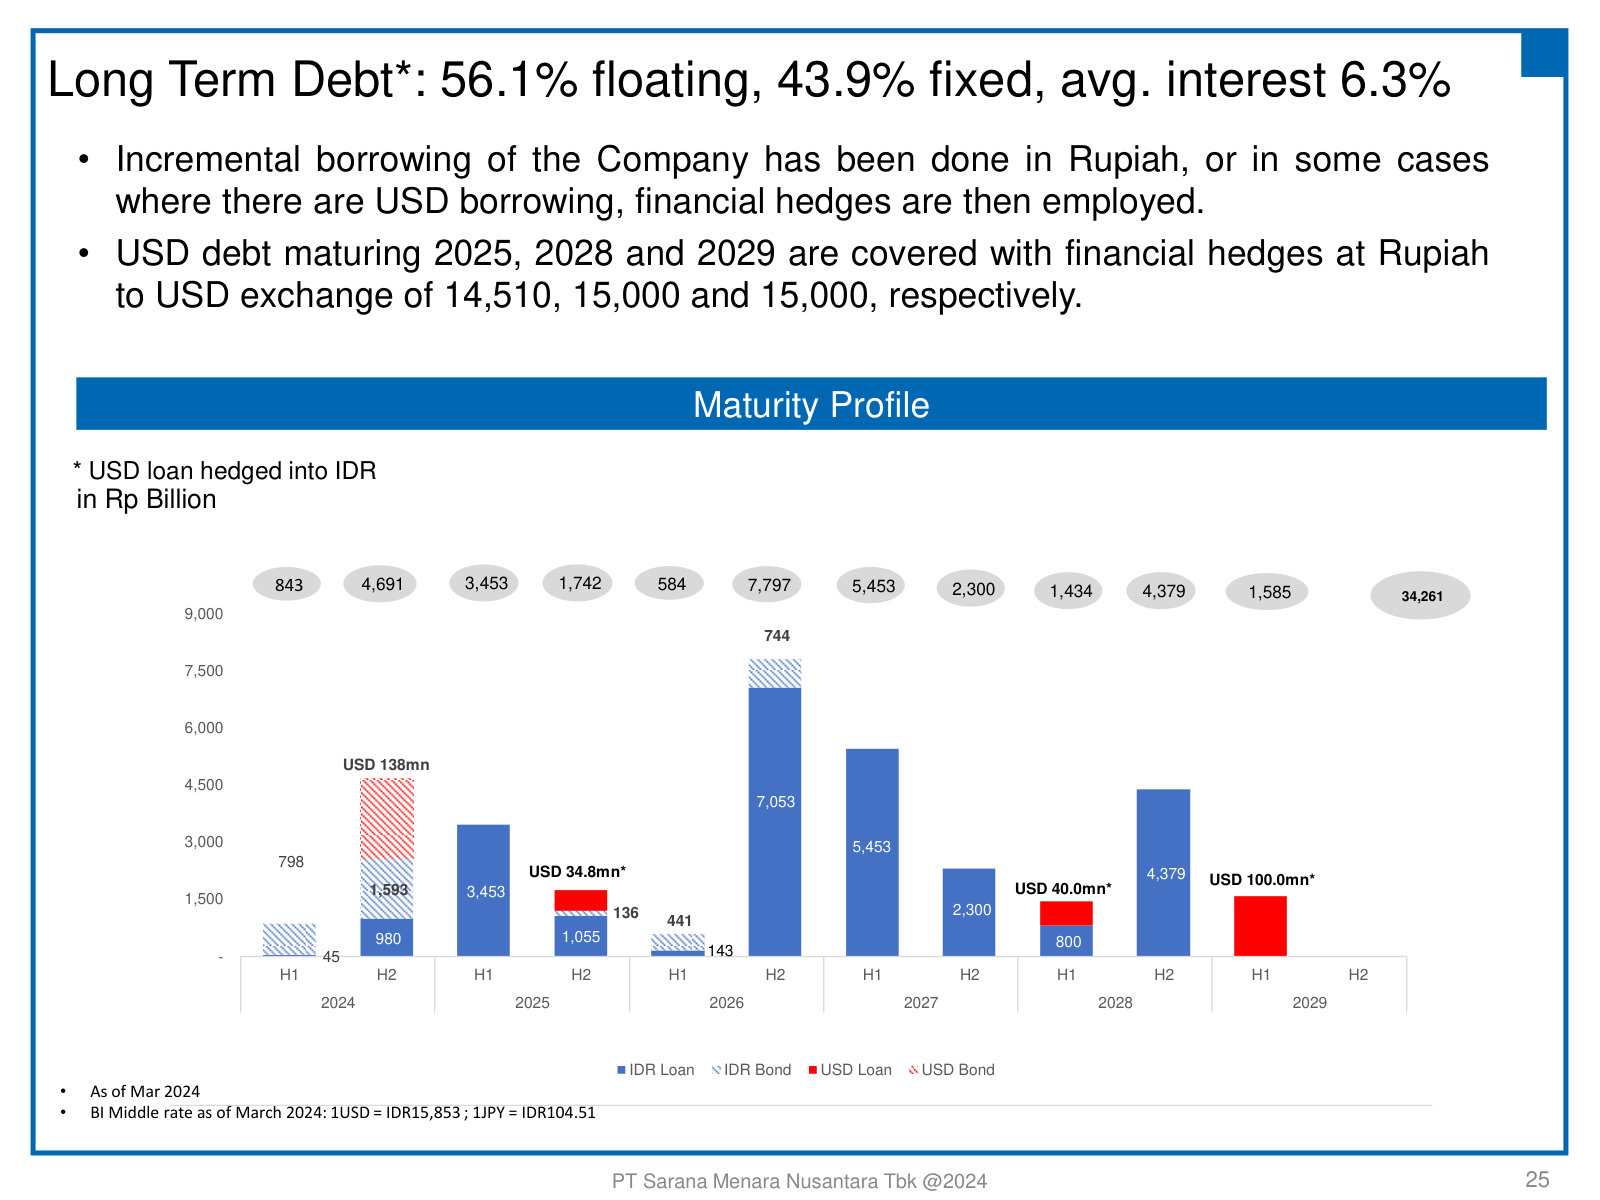
p. 2 — The investment case on one page: 31,049 towers, 220,975 km of fiber, mid-teens revenue/EBITDA CAGR and investment-grade ratings. · Open the full presentation →p. 3 — Six reasons management frames the business as low-risk, plus the internet-penetration and 1:2,700 tower-density backdrop driving demand. · Open the full presentation →p. 5 — Why the revenue is predictable: 10-year non-cancellable leases, high tenant switching costs, colocation upside and steep barriers to entry. · Open the full presentation →p. 6 — The unit economics — how built-to-suit towers compound over a lease, and how a second tenant lifts unlevered ROI from 11% to 21%. · Open the full presentation →p. 7 — Where the 31,049 towers sit: 18,141 across Java/Bali/NTT/NTB, the rest spread over Sumatra, Kalimantan, Sulawesi and eastern Indonesia. · Open the full presentation →p. 8 — The 220,975 km fiber footprint by island, split into tower fiber (FTTT), home fiber (FTTH) and backbone/submarine. · Open the full presentation →p. 10 — Management's Build–Buy–Return capital framework — build, acquire, protect the rating and dividend — with a trailing-year scorecard. · Open the full presentation →p. 11 — The four revenue lines explained — Tower, Fiber-to-the-Tower, Connectivity and Fiber-to-the-Home — and how each one feeds the next. · Open the full presentation →p. 12 — Capex shifting toward non-tower assets since 2016, shown alongside the tower tenancy ratio and fiber utilisation ratio. · Open the full presentation →p. 13 — The full growth history since 2007 — towers, tenancies and fiber — annotated with every major acquisition that built the portfolio. · Open the full presentation →p. 14 — Revenue, EBITDA and AFFO since 2016, showing steady tower revenue plus the fast-rising non-tower line and 11% EBITDA CAGR. · Open the full presentation →p. 15 — Rp71.4 trillion of contracted and committed revenue running through 2042 — the backlog behind the 'predictable cash flow' claim. · Open the full presentation →p. 16 — Leverage held near 4.3x through a decade of acquisitions, with the 1Q24 credit matrix and BBB-/BBB investment-grade ratings. · Open the full presentation →p. 18 — Seven years of consolidated income statement with margins — ~85% EBITDA margin, ~28% net margin — plus the 1Q23-vs-1Q24 column. · Open the full presentation →p. 19 — The consolidated balance sheet, 2016 to 1Q24 — asset base, ~Rp45tn debt load and the large treasury-stock position. · Open the full presentation →p. 20 — How cash converts in a quarter: collections fund capex, opex and interest before any financing, dividend and acquisitions. · Open the full presentation →p. 22 — Revenue by segment year-on-year — flat tower, fast-growing FTTT and FTTH, softer connectivity — the diversification story in numbers. · Open the full presentation →p. 23 — The operating drivers behind the growth — tower, tenancy, fiber-km, connectivity activations and FTTH home-connect counts. · Open the full presentation →p. 25 — How a Rupiah reporter with USD debt manages currency risk — USD cash and contracted revenue plus hedges on the bonds. · Open the full presentation →p. 26 — The debt maturity profile and mix — 56% floating / 44% fixed at 6.3% average, with USD tranches hedged into Rupiah. · Open the full presentation →
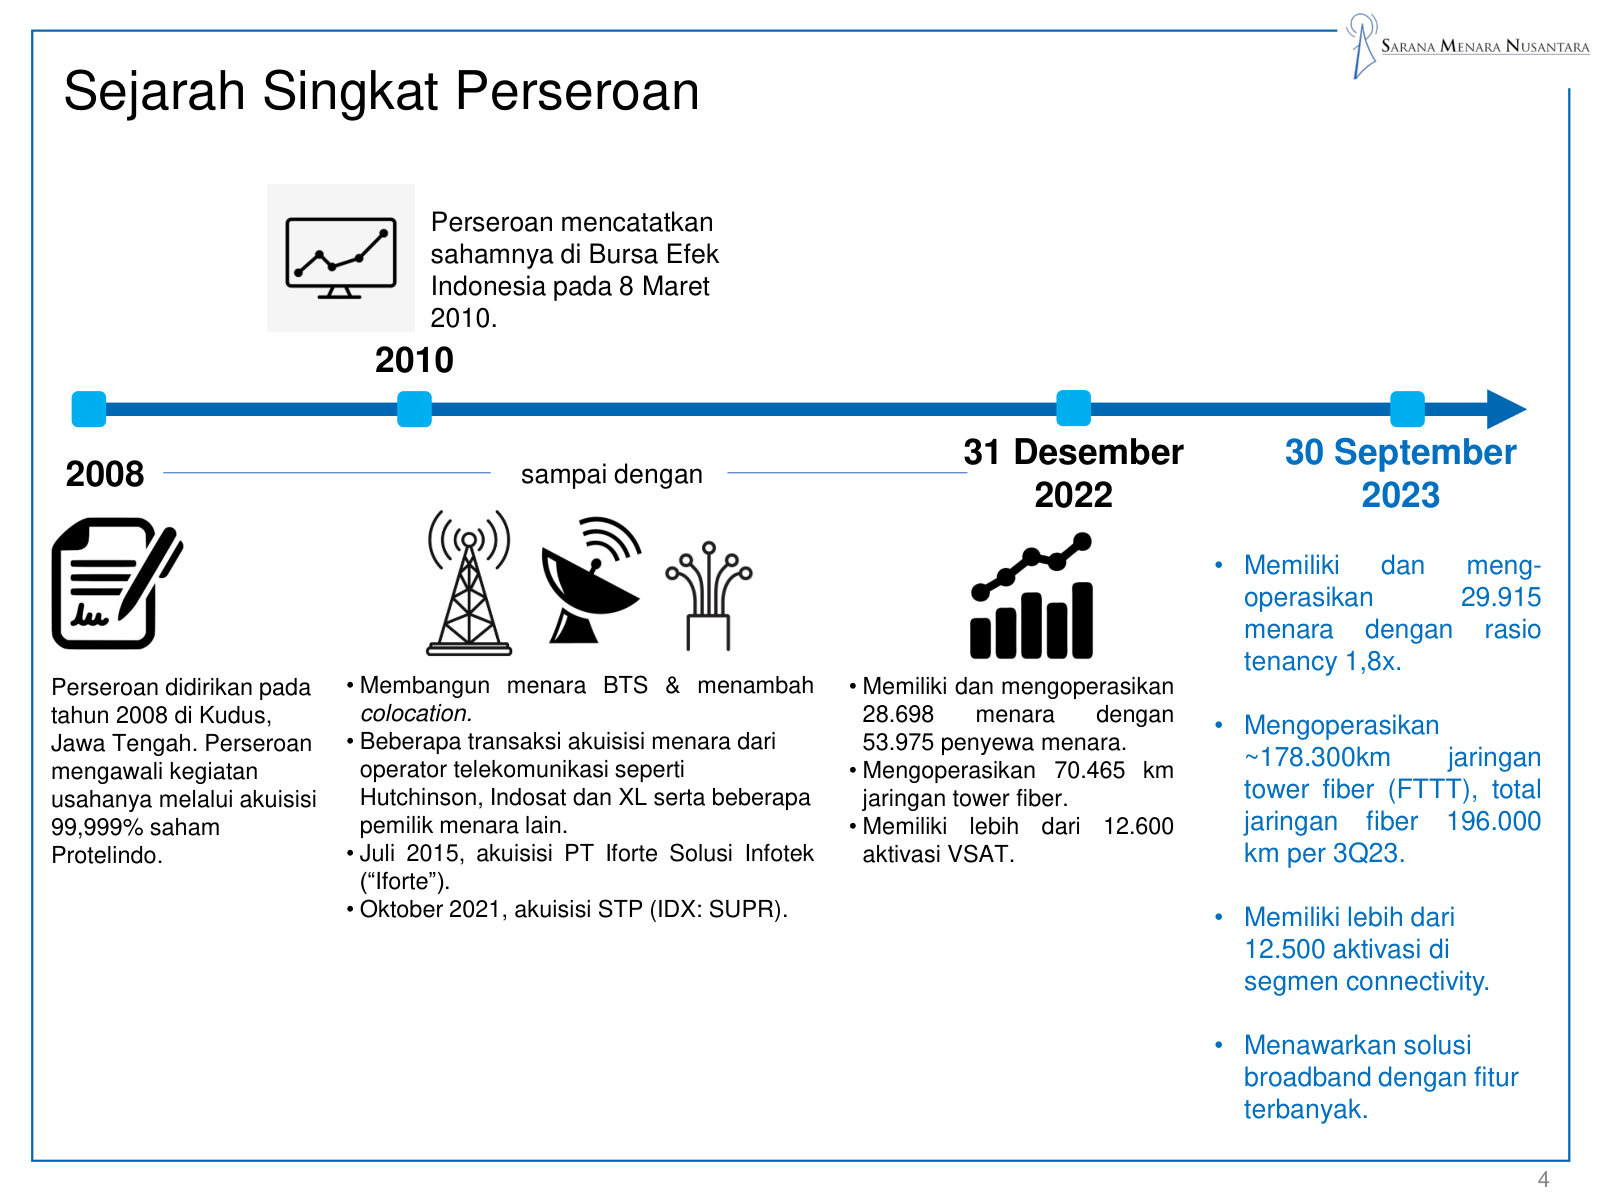
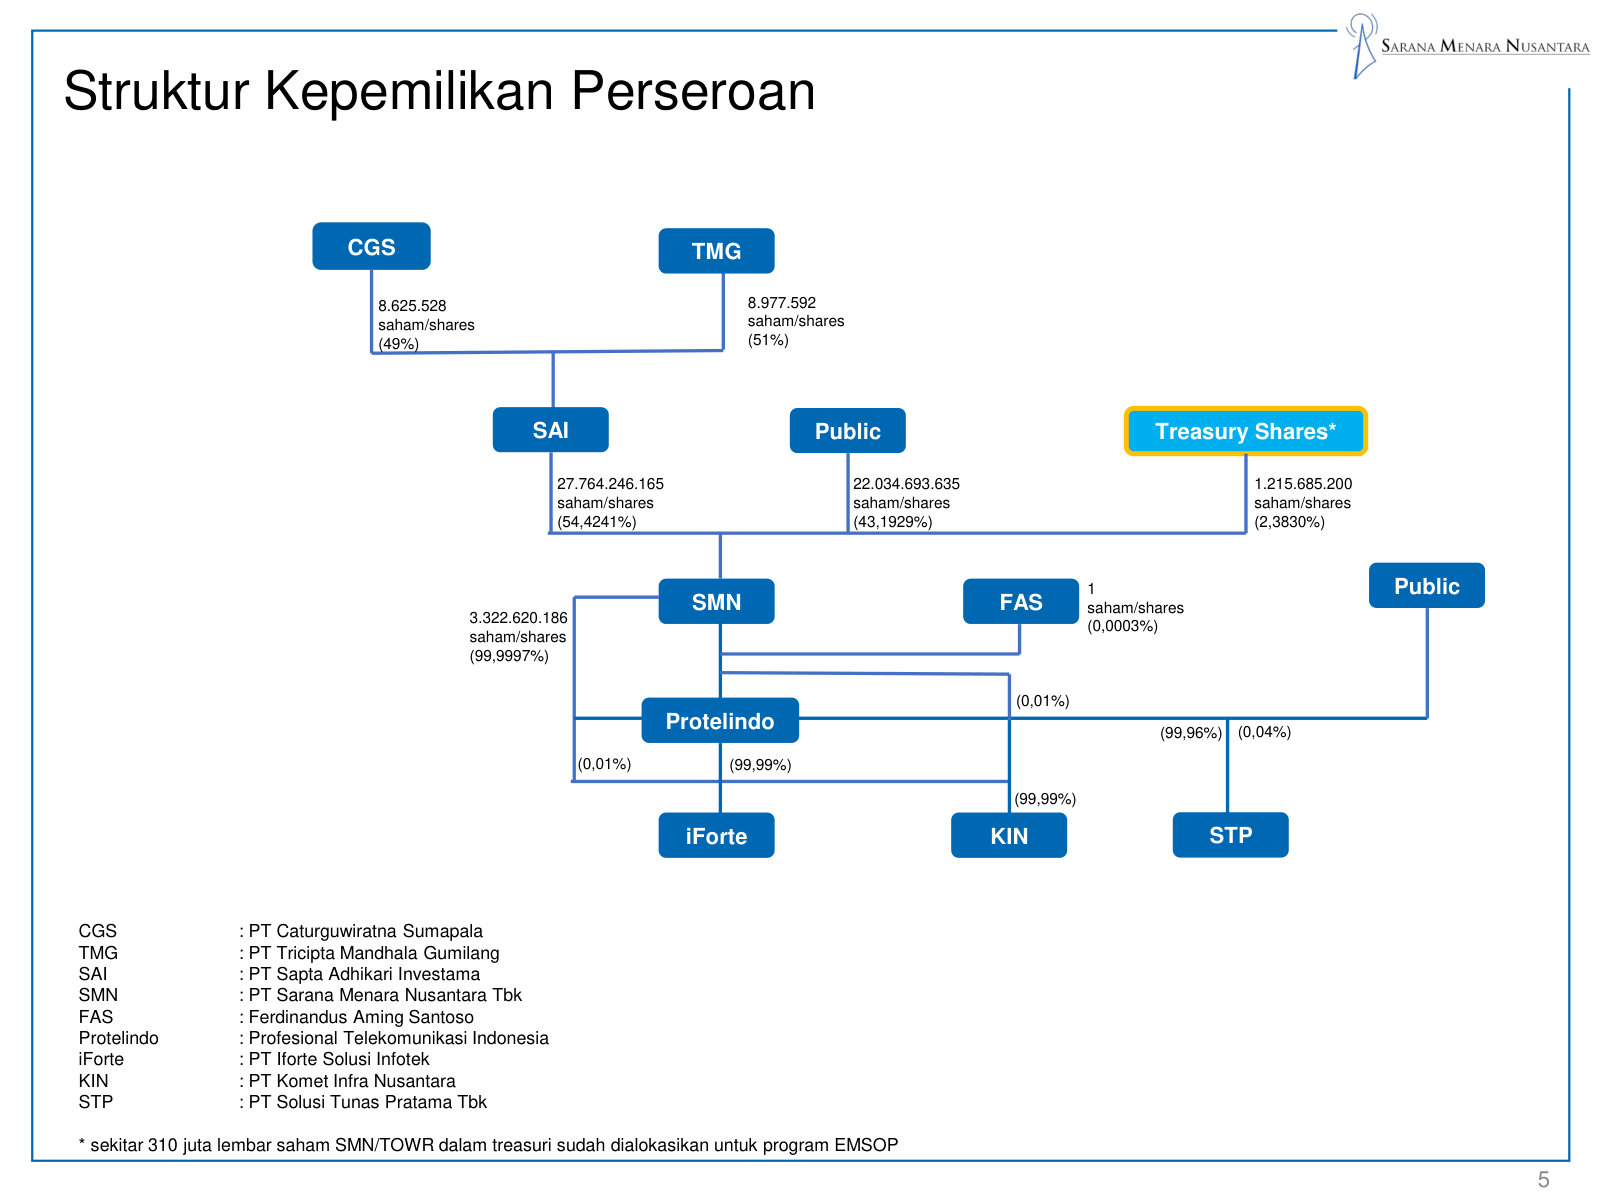
The prior-year deck, kept only for the two things the 2024 edition drops: company history and the full ownership structure. · Open the full document →
p. 5 — The company's origins — founded in Kudus in 2008, listed in 2010, built out through the Hutchison, Indosat, XL and STP acquisitions. · Open the full presentation →p. 6 — The ownership chain — CGS and TMG via SAI hold 54% of SMN, which owns 99.99% of Protelindo; 43% public float, 2.4% treasury. · Open the full presentation →